Click here to view the full DEA Conditions.
SEE FULL TEXT BELOW:
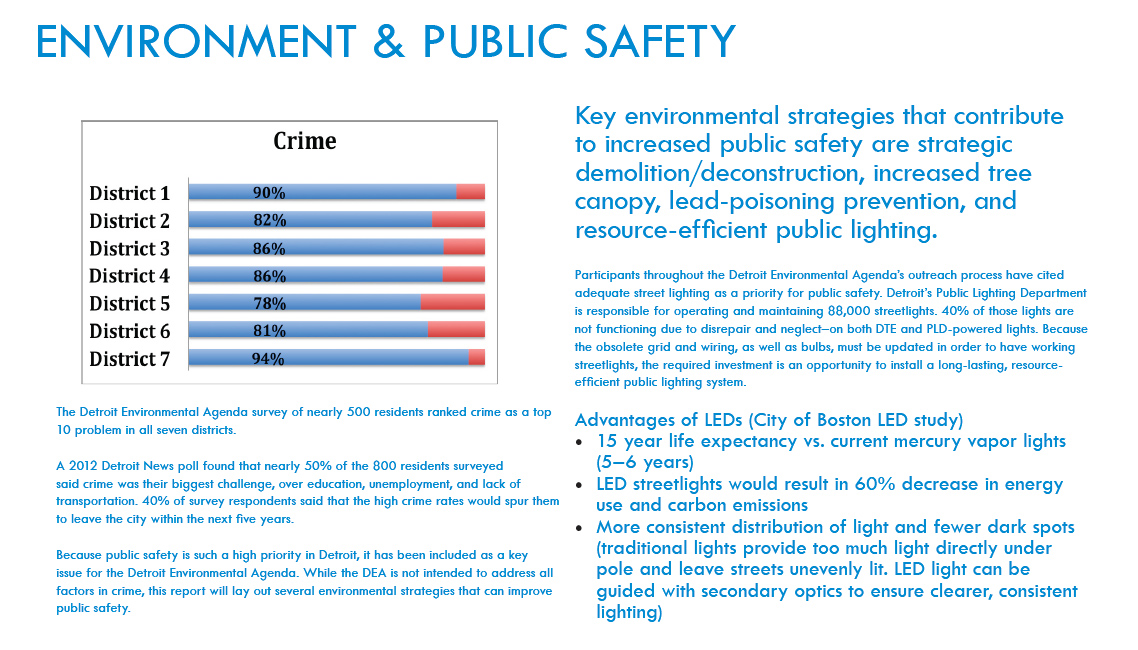
ENVIRONMENT & PUBLIC SAFETY
(Image: Crime by District)
The Detroit Environmental Agenda survey of nearly 500 residents ranked crime as a top 10 problem in all seven districts.
A 2012 Detroit News poll found that nearly 50% of the 800 residents surveyed said crime was their biggest challenge, over education, unemployment, and lack of transportation. 40% of survey respondents said that the high crime rates would spur them to leave the city within the next five years.
Because public safety is such a high priority in Detroit, it has been included as a key issue for the Detroit Environmental Agenda. While the DEA is not intended to address all factors in crime, this report will lay out several environmental strategies that can improve public safety.
Key environmental strategies that contribute to increased public safety are strategic demolition/deconstruction, increased tree canopy, lead-poisoning prevention, and resource-efficient public lighting.
Participants throughout the Detroit Environmental Agenda’s outreach process have cited adequate street lighting as a priority for public safety. Detroit’s Public Lighting Department is responsible for operating and maintaining 88,000 streetlights. 40% of those lights are not functioning due to disrepair and neglect – on both DTE and PLD-powered lights. Because the obsolete grid and wiring, as well as bulbs, must be updated in order to have working streetlights, the required investment is an opportunity to install a long-lasting, resource-efficient public lighting system.
Advantages of LEDs (City of Boston LED Study)
- 15 year life expectancy vs. current mercury vapor lights (5-6 years)
- LED streetlights would result in 60% decrease in energy use and carbon emissions
- More consistent distribution of lights and fewer dark spots (traditional lights provide too much light directly under pole and leave streets unevenly lit. LED light can be guided with secondary optics to ensure clearer, consistent lighting)
Vacant vs. Abandoned
(Images)
Source: Raleigh & Galster “Neighborhood Disinvestment, Abandonment and Crime Dynamics” WSU 2013
- 78,000 Vacant structures
- 38,000 Dangerous buildings
- 11,000-12,000 fires annually in past decade
60% of fires occur in blighted or unoccupied buildings. Vacant homes quickly become abandoned homes in unaddressed.
Source: 2013 EM Report to Creditors, Detroit Free Press
Vacant Land
(Image)
A 2013 Wayne State University study found that while intact vacant houses were correlated to crime activity, abandoned structures (such as those fire damaged beyond repair) were less correlated to crime, and vacant land with no structure even less so. According to the study, recent foreclosures may be a more likely attracter of criminal activity than the fire-damaged or VOD buildings. Further study should be conducted to determine whether the following safety recommendations are viable:
- Prioritize vacant yet intact houses for reoccupation in stable neighborhoods for public safety. Keeping homes occupied can reduce crime attracted to vacant houses.
- Prioritize for architectural salvage and deconstruction vacant yet intact houses that are isolated and in areas that the community designates for alternative use.
- Prioritize for rapid, geographically grouped, environmentally safe demolition of severely damaged properties to increase walkability, perception of safety, decrease pressure on the fire department, and preserve property values and neighborhood quality of life.
(Image: Housing with Safety Issues)
(Images: Parcels with at Least One Mortgage Foreclosure)
Compare locations of violent crime (assault, robbery) and property crime (burglary, destruction/vandalism, drug/narcotics, larceny, motor vehicle theft) in the first quarter of 2010 (see maps to right) to 2009 housing conditions (upper left) and 2005-2010 mortgage foreclosures (lower left). A recent WSU study currently under peer review found that crimes more frequently occurred on blocks with higher renter occupancy, more liquor licenses, lower population density, and more crime on adjacent blocks (Galster & Raleigh 2013).
(Image: Number of Violent Crimes by Census Block – Q1/2010)
(Image: Number of Property Crimes by Census Block – Q1/2010)
More Trees, Less Crime
(Image: Tree Canopies as a Percent of Total Lot Area – 2008)
After nine months of data analysis on 2,813 homes in a Portland, Oregon, neighborhood that experiences a crime rate of 50% higher than the national average, the U.S. Forest Service found that tree-lined streets and yards with larger trees were linked with lower property crime and violent crime rates. The study controlled for over 24 other variables such as size, age, value, condition of the house, types of barriers, and presence of a neighborhood watch, burglar alarm, dog, or bars on the windows.
Sources: “The Effect of Tree on Crime in Portland, Oregon.” US Forest Service. 2011; “The Relationship between Tree Canopy and Crime Rates across an Urban-rural Gradient in the Greater Baltimore Region.” University of Vermont. Landscape and Urban Planning. 2011; “Tree Cover % – How Does Your City Measure Up?” www.deeproot.com. Info from Watt & Gunther, New York City Department of Parks. 2010.
A Baltimore study of the urban tree effect found that a 10% increase in neighborhood trees roughly corresponded with a 12% decrease in crime.
Because trees also help cool the city, filter air pollution, reduce stress on the sewer system, and beautify a neighborhood, increasing the urban tree canopy is a multipurpose strategy for improving public safety.
Southwest Detroit has the lowest percentage of tree canopy.
Detroit’s tree canopy is only 22.5% overall, compared to a national average of 27% and Atlanta’s 36% (highest of all major cities). American Forests recommends 40% tree cover for cities east of the Mississippi.
Detroit’s tree canopy is lower than both the national average and the recommended percentage for cities.
Detroit lost 500,000 trees between 1950 and 1980 to dutch elm disease, urban expansion, or neglect. A new invasive pest in 2002, emerald ash borer, decimated the city’s ash trees, which had been planted to replace lost elm trees. The Greening of Detroit has teamed up with community and volunteer groups to plant 70,000 trees in Detroit since 1989.
(Image: Lead Poisoning by District)
Lead poisoning has been linked with crime in multiple studies over the past several decades. A longitudinal study in Philadelphia followed 497 black males from birth to age 24, studying 150 variables that could contribute to later criminal behavior. After adjusting for other factors such as poverty, presence of a father, race, education, etc., the only variable independently linked to adult criminal behavior, juvenile criminal behavior, and school misbehavior was childhood lead poisoning.
Along with the rest of the nation, Detroit’s lead poisoning rate has declined since the 1990s when the federal government began to invest in lead poisoning prevention. However, lead poisoning is indeed a serious issue in Detroit, with child lead poisoning rates several times higher than that of the state and the nation (see map to right). We have lead contamination in Detroit from several key sources – current and historic industrial activity that is the source of air deposition of lead, housing built before lead-based paint was banned in 1978 (over 90% of all low-income Detroit housing), and ground contamination from vehicle emissions running on leaded gasoline before that was phased out in the 1990s. As indicated in the image above, over 25% of survey respondents in all seven districts did not know if lead poisoning was a serious issue in their neighborhood. In the lead poisoning hot spot analysis below, red indicates higher hot spot scores, while blue indicates lower hot spot scores. District 3, 4, 5 and 6 have significant hot spots of children with high blood lead levels.
(Image: Hot Spot Analysis of High Blood Lead Levels in DPS Students by 2000 Census Block)
Source: Detroit Public Schools and Detroit Dept of Health and Wellness Promotion 2010 (1.Getis-Ord Gi*)
Detroit Free Press Soil Samples – Shelby Township vs. Northeast Detroit
(Image: Suburban vs. Urban Census Tract)
The Detroit Free Press investigation found that soil lead contamination in northeast Detroit at Gratiot and 7 Mile was 40 or 50 times the level in Macomb County, and well above the EPA limit of 400 parts per million. Currently, a study is being conducted to determine whether residential demolition increases lead contamination in surrounding soil. The City of Baltimore has instituted lead-safe demolition standards to address the issue there.
Often a home is in need of more than one type of repair – lead abatement, roof replacement, weatherization, fire safety, mold abatement, and so on. However, because different agencies administer the various programs, low-income Detroit homeowners may not be able to receive all of the repairs they need. The Detroit-Wayne County Green and Healthy Homes Initiative is advocating for geographical concentration of comprehensive home assessment and rehabilitation through multi-sector and interagency coordination. Led by ClearCorps/Detroit, the Detroit Enforcement Work Group is identifying strategies to increase landlord compliance with the 2010 Detroit Lead Ordinance, which updated the property maintenance code to require rental property owners to have their properties assessed and addressed for lead paint hazards.
Percentage of Homes Likely to Contain Lead-based Painted determined by Age of Housing.
(Image)
Over 90% of Detroit’s low-income housing was built before lead paint was banned.
(American Community Survey 2011)
Lead Poisoning & School Rankings
(Table)
Because child lead poisoning has been linked in numerous studies to lower IQs, increased aggression, ADHD, juvenile delinquency, and adult criminal behavior, lead poisoning prevention should be one of Detroit’s top priorities. Poor nutrition (calcium and iron deficiency) makes children even more susceptible to the impacts of lead poisoning, making elevated blood lead levels an even greater challenge for low-income Detroit children than others who may be exposed to lead hazards.
The US phaseout of leaded gasoline, in US cities as well as in other countries around the world, is correlated with falling rates of crime.
(Image)
Elevated blood lead levels are correlated with drops in IQ.
(Image)
Federal lead abatement programs administered through state and city government must continue to aggressively eliminate lead paint hazards and coordinate abatement with other home rehabilitation and weatherization programs, landlords must comply with the Detroit lead ordinance to address lead hazards in homes they rent to families, construction and demolition processes must be monitored for lead-safe practices, and healthy food access must be supported to help children fight the impacts of lead poisoning through proper nutrition.
Since 1998, lead poisoning rates decreased by 89% because of coordinated efforts and smart investments in rigorous testing, home lead abatement, code enforcement against negligent landlords, and treatment for lead poisoned children. However, recent state and federal cuts will reverse our progress.
“Success must be sustained, not stopped in its tracks.” – Luke Thompson, WSU and GHHI
(Image: Children 0 to 5 with Confirmed Elevated Blood Lead Levels – 2000)
(Image: Children 0 to 5 with Confirmed Elevated Blood Lead Levels – 2010)
Detroit’s child lead poisoning rate has declined between 2000 and 2010. However, Detroit’s rate is still significantly higher than the state and national averages, and there are still areas of the city with high rates, particularly in District 5, and slightly less so in Districts 6, 3, and 4.
ENVIRONMENT, LAND & WATER INFRASTRUCTURE
(Image: Vacant Land Not Cared For by District)
(Image: Public Land Ownership by Agency)
(Image: Vacant Lots, as Percentage of Residential Parcels)
Vacant land refers to parcels with no structure present. All seven districts ranked “Vacant Land Not Cared For” in their top 10 problems. As can be seen in the green Data Driven Detroit map above, vacant residential lots are a significant issue in all of the city but most of District 2, the Grandmont Rosedale area, and the borders of the city near 8 mile west of Woodward, and the far eastside neighborhoods bordering the Pointes. District 2’s unexpectedly high ranking of this issue may be due to the high number of survey responses coming from the Davison area, which borders Districts 5 and 7, and the low total number of responses from District 2.
(Image: Blue and Green Infrastructure)
(Image: CDAD Strategic Framework Current Conditions Analysis)
The Detroit Future City map of publicly owned land (below far left) indicates that a large portion of the land in the high vacancy areas are owned by public entities, most significantly the City of Detroit. Further analysis should be conducted to identify areas where high concentrations of vacant land with no structure are owned by the City of Detroit, the Wayne County Treasurer, and other public land holding agencies.
The map above to the left describes areas considered suitable for blue and green infrastructure by the Detroit Future City Strategic Framework Plan. The map above to the right indicates a spectrum of suitability for residential land use and alternative green land uses based on a variety of factors, including population density, population change, ownership, housing conditions, and more. The map to the immediate right demonstrates Combined Sewer Overflow pilot areas for the Detroit Water Sewerage Department.
In the abundance of vacant land lies opportunity for large-scale green infrastructure to significantly reduce combined sewage overflows to the rivers while addressing vacant land, a top priority of Detroit residents. This will require effective coordination with other public property owners, partnership with community land use visioning efforts, guided by the regional Green Infrastructure Vision led by SEMCOG, and suitability analyses conducted by various entities, including Detroit Future City, the Community Development Advocates of Detroit (CDAD) Strategic Framework Plan, and forthcoming research from Liquid Planning Detroit (University of Michigan).
(Image: CSO Pilot Areas)
(Image: Dry Weather vs. Wet Weather)
(Image: Sewage in Rivers, Waterways by District)
(Image: Annual Combined Sewage Overflow Volume and Number of Events)
The DEA survey results indicated that over a quarter of respondents in most of the council districts did not know the seriousness of sewage discharges to the rivers.
Detroit’s sewage infrastructure, like that of other older cities, carries both stormwater and household/industrial wastewater. During heavy rain events, the infrastructure – even with new holding facilities – cannot hold and treat all of the wastewater. (See the EPA’s diagram of Combined Sewer Overflow to the left. “POTW” in the diagram can be replaced with the Detroit Wastewater Treatment Plant.)
This results in billions of gallons of untreated or partially treated sewage water being released into the Detroit and Rouge Rivers. Although new holding facilities such as the Conner Creek CSO Facility along the far east riverfront have reduced outflows, they have been very costly ($201.4 million for Conner Creek) and CSO discharges into the rivers continue. The Michigan Department of Environmental Quality’s annual reports on combined sewage overflows indicate that although the number of discharge events have dropped to less than 50 per year from a peak of over 400 in 2004, the actual volume of raw and partially treated sewage continues to fluctuate, reaching a 5-year high in 2011 at 28 billion gallons of overflow (this figure includes 6.15 bg untreated overflow and 21.6 bg partially treated discharge).
(Image: Volume of Sewage Discharges by Outfall Location)
(Images: Surface Map)
Both the Detroit Water Agenda (published through the City Council Green Task Force in 2012) and the Detroit Future City Strategic Framework Plan emphasize the need for green infrastructure to alleviate the combined sewer overflow issue. With Detroit’s abundance of vacant land in need of cleanup and maintenance, this provides an opportunity to hit multiple birds with one stone. The Detroit Water and Sewerage Department, in partnership with the Southeast Michigan Council of Governments (SEMCOG) and The Greening of Detroit, is pursuing green infrastructure as an alternative to extremely costly conventional sewer infrastructure, beginning with pilot projects in Rouge Park and Brightmoor.
SEMCOG is developing a regional green infrastructure vision with other Detroit shareholders. Given the impact of regional wastewater on Detroit’s sewer infrastructure, elected leadership in Detroit should take an enthusiastic role in the process. Several other large cities (notably New York and Chicago) have launched major green infrastructure initiatives to address their stormwater challenges through grant programs, water bill credits, zoning amendments, and development standards to encourage a variety of strategies, including green roofs, green alleys, rain gardens, permeable parking lots, and more.
City Council District Percent Impervious
1 40.11%
2 47.35%
3 47.89%
4 46.60%
5 47.06%
6 50.97%
7 42.63%
Sources: Sanborn (2008); Data Driven Detroit 2012
*This calculation does not include roads, which would increase the numbers.
46.18%* of Detroit’s land is impervious, meaning that water cannot filter naturally into the ground.
(Image: High Water Bills by District)
Survey respondents in 3 out of 7 districts (indicted in blue and red) ranked high water bills in their top 10 environmental problems. Water bills go to pay for Detroit Water and Sewerage Department (DWSD) infrastructure debt as well as operating the water and sewer systems. A 2012 DWSD brochure explains that declining water sales due to factory cutbacks, population decline, and increased water conservation and reduced water usage have resulted in higher rates.
The department acknowledges that it must change to respond to a future with less water consumption. The last Water Master Plan was published in 2003 and projected 2% annual growth for 50 years; “the reality has been 3% contraction for the last 4 years!” (DWSD “Putting Rate Increases into Perspective”)
The Detroit Emergency Manager’s June 2013 proposal for creditors suggests spinning off the water department into an independent New Metropolitan Area Water and Sewer Authority to be overseen by a regional board of directors. The system would be owned by the city and manged by the board.
Because the original plan to upgrade Detroit’s sewer infrastructure was too expensive, DWSD shifted its approach to include green infrastructure strategies to harness the environment for natural water filtration. Even so, green infrastructure investment only accounts for 6% of the overall combined sewer overflow budget.
Whatever authority ultimately manages the Detroit Water and Sewerage Department must find a way to encourage water conservation and on-site stormwater management. It must not rely on increased water consumption to pay infrastructure debt.
The Great Lakes account for 95% of U.S. surface freshwater, and over 20% of the world’s freshwater supply. Much of the coastlines are polluted from historic and current industry and combined sewage overflows. How will we steward our biggest natural asset?
(Image: Great Lakes Areas of Concern)
(Image: Belle Isle Beach)
Photo: Sandra Yu
ENVIRONMENT & MOBILITY
(Image: Hard to Get Places Without a Car by District)
(Image: Infrequent Buses by District)
(Image: Not Safe to Walk by District)
Detroiters need to be able to conveniently and reliably get to work, school, church, stores, and parks.
Several surveyed challenges related to lack of mobility ranked in the top 10 problems in at least 4 out of 7 districts. As indicated by the DEA survey results and numerous other forms of civic engagement, mobility and transportation are priority issues in Detroit.
Therefore, we need to ensure reliable public transportation, “complete streets” safe for all users including pedestrians and cyclists, and mixed use neighborhoods with amenities.
As retail, grocery stores, factories, and jobs have moved out of the city, residents are left with long, unreliable bus commutes or limited choices within the city.
According to the U.S. Census Longitudinal Employer-Household Dynamics, 70% of all jobs located in Detroit are occupied by people who don’t live in or pay taxes to the city. Of the residents who are employed, 60% of them travel outside of the city to their jobs. In addition, as of May 2012, 20.46% of Detroit Public School students rely on DDOT buses to get to school (MISchoolData.org, Data Driven Detroit July 2013). 1 in 4 Detroit households do not have access to a vehicle (American Community Survey 2011), leaving over 100,000 Detroiters dependent on rides, public transportation, walking, biking, or other means of travel.
There are significant challenges to car ownership in Detroit – high insurance rates, cost of owning a car, cost of fuel. Also, Detroiters suffer from high rates of asthma and other illnesses that are exacerbated by motor vehicle emissions.
However, according to the 2011 American Community Survey, Detroiters who rely on public transportation are more than 5 times as likely to have to commute for an hour or more than those who drive, bike, or walk. After comparing published schedules to actual arrival times of buses along right major routes during the week of October 17-21, 2012, Transit Rider United gave the DDOT bus system a D for on-time performance, up from a D- grade given that spring.
(Image: Where do Detroiters Work?)
(Image: Households Without Vehicle SMART Service Area)
It’s been a busy couple couple of years for metro Detroit transportation.
REGIONAL TRANSIT AUTHORITY
After 23 failed attempts since the 1970s, a Regional Transit Authority was finally established by the Michigan Legislature and signed by the Governor in 2012 to coordinate, oversee, and improve transit for Macomb, Oakland, Washtenaw, and Wayne Counties, including Detroit. The RTA board is tasked with developing a regional master transit plan for the four represented counties including Detroit, coordinating existing transit providers, and raising federal and state funding to implement the plan. A key component of preliminary plans is to establish a bus rapid transit service from Detroit to Pontiac along Woodward Avenue.
BUS RAPID TRANSIT
After months of study, Bus Rapid Transit emerged as the leading option for the 27-mile corridor along Woodward Avenue from Detroit to Pontiac. According to Carmine Palombo, director of transportation planning for the Southeast Michigan Council of Governments, the project aims to “provide high level, fast transit service that would compete with the automobile from Pontiac to Detroit’s riverfront and vice versa.” (Crain’s Detroit Business April 2013) Michigan will spend a $25 million federal TIGER grant on this first phase. A 110-mile regional BRT system is believed to be cheaper to build than the canceled $528 million 9.3-mile light rail system would have cost.
M1 RAIL
The light rail along Woodward Avenue is finally funded to begin construction this summer downtown, south of Adams Street. The $137-40 million private-public project will extend 3.3 miles up Woodward Avenue (also known as M1) from Detroit’s Hart Plaza to New Center, and cost an estimated $5.1 million per year to operate. M1 will run an 11-stop, mostly curbside, fixed-rail streetcar circulator system, commingled with traffic. At its north and south ends, the streetcars will run in the median. There is a future 12th stop proposed.
TEXTMYBUS
As part of efforts to improve rider experience on local buses, the Detroit Department of Transportation partnered with Code for America Fellows to develop a mobile text service called TextMyBus and smartphone app called Stop313 that uses GPS systems on the buses to tell bus riders exactly when the next three buses for a requested stop will arrive.
I-94 EXPANSION APPROVED
Despite strong public opposition, SEMCOG approved the $1.8 billion 7-mile expansion of I-94 from 6 lanes to 10, from I-96 through Midtown eastward to Conner Avenue.
(Image: Light Rail)
Source: M1 Artist renderings
BRT: A Rapid Overview
(Image: NYCDOT)
What exactly is a BRT?
A BRT is comprised of seven elements [1] These are:
- Running Ways: On a scale from most-to-least rapid, these range from dedicated, grade-separated lanes that are used exclusively for transit use, to general traffic lane that accommodate both cars and buses.
- Stations: BRT stations tend to be a step-up from the standard lonely-sign-between-street-and-sidewalk bus stop. They usually feature covered waiting areas and can be fully enclosed and climate-controlled.
- Vehicles: These are often higher capacity than normal buses, and they can be coordinated with station platforms to provide seamless, on-grade boarding.
- Services: Typically higher-frequency, more reliable service than a conventional bus system.
- Route Structure: Major routes feature fewer stops than conventional bus systems, and serve as a spine that connects riders to local routes.
- Fare Collection: Buses typically feature multiple door boarding and streamlined fare collection through card readers and prepayment systems.
- Intelligent Transportation Systems (ITS): ITS allow users to monitor buses online, check arrival times, and prepay, among other things.
Commuter Triangle: Detroit shifted from a light-rail transit system to a larger regional network of high-speed buses. The quality regional transportation system must be the highest priority for our major corridors in order to connect residents to jobs. (Image)
TextMyBus uses DDOT’s real-time bus tracking to tell bus riders when the next bus will arrive.
- Text your nearest intersection to 50464
- You will receive a list of nearby bus routes
- Text back your desired route
- You will get a message back indicating the closest bus stop and next three bus arrival times
(Image: Miles of Major Off-Road Paths by District)
(Image: Detroit bike lane)
Source: Greenways Coalition
(Image: Off-road path)
Source: Greenways Coalition
(Image: Miles of Bike Lane & Routes)
Non-motorized transportation expands healthy options
In a city where 33% of our low-income residents and 38% of our elderly residents don’t have access to a car and the local bus system is given a D grade, many residents walk, bike, and ride scooters on the roadways to get where they need to go. Even residents who have cars want to be able to walk or bike to amenities. Detroit’s Non-motorized Transportation Master Plan, adopted in 2006, is guiding the creation of biking and walking infrastructure and facilities in the city.
(Image: A Charlotte, N.C. complete street)
Source: National Complete Streets Coalition
Complete Streets make roadways safe for all users, including pedestrians, cyclists, seniors on scooters, parents with strollers, and children – not just automobiles. The Detroit Complete Streets Coalition is advocating for a local complete streets policy, currently under review at the Law Department.
(Image: Jefferson East Business Association sponsored June of Jefferson, a summer collection of popup businesses (temporary restaurant and retail establishments) at Jefferson and Chalmers to demonstrate what a walkable, mixed-use community there could look like.)
Photo: Nicole Rupersburg, Eat it Detroit
Walkable communities improve quality of life because a mix of goods and services are within an easy and safe walk from home. Pedestrian activity increases transportation options and makes communities safer through greater social interaction and more eyes on the street. The Clark Park neighborhood in Southwest Detroit is highly walkable, with parks, schools, grocery stores, homes, and shops all within close proximity. More of Detroit should have walkable communities.
In 2012, a joint workgroup of the City Planning Commission and the Planning Department updated the zoning code to create two mixed-use zoning designations. In addition to making communities more walkable, mixed-use areas can help support local business development.
ENVIRONMENT & URBAN CLEANLINESS
(Image: Illegal Dumping by District)
(Image: Litter by District)
Survey respondents ranked Litter, No Recycling, and Illegal Dumping high on their list of serious environmental problems.
Detroiters want to live in a beautiful, clean environment. We want to breathe clean air, drink and swim in clean water, garden in clean soil, and play in clean parks.
However, past and current industrial pollution, truck and freeway traffic, sewage overflows, litter, illegal dumping, the municipal waste incinerator, the sewage sludge incinerators, substandard demolition practices, leaded gasoline, lead-based paint and asbestos, and toxic household cleaning products all degrade our environment and put our health at risk.
A 2009 study prepared for Keep America Beautiful found that the number and convenience of trash receptacles strongly influence litter, older people are less likely to litter, and that existing litter attracts more litter. It also found a near unanimous belief that littering is wrong, but that positive motivational campaigns and convenient opportunities to not litter are key to stopping littering behavior. In Detroit, public parks have trash receptacles, but are often overflowing. Detroit parks are often used for social gatherings involving food. Receptacles must be quickly emptied; otherwise there is no place to dispose of the trash and litter will accumulate, no matter someone’s best intentions.
Illegal dumping is when trash and other debris are discarded in areas not designated for waste. It can catch fire in the sun, injure people, become home to disease-carrying flies, mosquitoes, and rodents, and contaminate groundwater and soil, as well as contaminate water bodies when it rains. Illegal dumping occurs for convenience, to avoid disposal costs, low fines or lack of enforcement, and lack of public awareness of its threats to environmental and human health.
Although there are quarterly bulk pickups by the City and five drop-off locations (see “DPW drop-off locations” on map on facing page), illegal dumping persists, especially in areas of high vacancy. Dumping will often occur at a vacant or abandoned property to avoid fines on an occupied property. Residents and the City must work together to enforce illegal dumping laws against violators. Residents are asked to provide information about dumpers, but the City should develop a public tracking system to help keep pressure on enforcement.
Detroit ranked last out of 27 North American cities in the Siemens Sustainability Index (2011) for waste. After growing recycling options and piloting curbside recycling, Detroit’s 2012 recycling rate (7%) is a great increase from its 2006 recycling rate of 0.1%; however, it is still well below the average (26%). San Francisco, which ranked highest in the 2011 index, now recycles over 80% of its waste.
(Image: Average Recycling Rate)
*Average recycling rate (26%) of Siemens Index Cities
(Image: No Recycling by District)
(Image: Recycling Locations)
14.8% of Detroit Households Have Access to Curbside Recycling (Image)
Source: Detroit Department of Public Work, Zero Waste Detroit
ENVIRONMENT & ECONOMICS
(Image: High Heating Bills by District)
(Image: Number of Detroit low-income owners or renters by Year of Construction)
Chart Source: U.S. Census 2000
Homes built before 1949 have the highest annual average energy bills of all houses built in any year. (U.S. Energy Information Administration)
Survey respondents in 6 out of 7 districts ranked high heating bills in their top 10 problems. Houses that are old, large, or in disrepair are likely to be more expensive to heat and cool.
In 2008, Michigan enacted a Renewables Portfolio Standard that mandated utilities generate 10% of their retail electricity sales from renewable energy resources by 2015.
It also allowed utilities to use energy optimization (energy efficiency) and advanced cleaner energy systems to meet part of the requirement. The state’s two largest investor-owned utilities (DTE and Consumers) have additional obligations. The 2008 RPS led to DTE’s and Consumer’s energy optimization and renewable energy programs, which have helped homeowners and businesses to conduct free or low-cost energy audits and implement energy-saving measures.
Average Detroit Household Energy Cost – $2,159/year
Average Household Savings from Weatherization – $437/year
Detroiters spend 2x as much of their annual household income on energy bills as the rest of the state. Weatherization could cut annual costs by 20%.
72 cents of every dollar spent on energy by Michigan’s citizens and businesses flows out of the state. Burning coal costs the U.S. $500 billion in health and environmental costs every year.
(Table: Total Emissions, DTE Energy Electrical Generators, Wayne County, 2008, EPA National Emissions Inventory)
(Image: The Green Garage in Midtown cut energy demand by 90% with a solar thermal water heater, and passive design strategies, including a white roof, natural lighting, triple-glazed windows and extra-thick insulation, and high-efficiency mechanical systems.)
Courtesy: Green Garage
DTE Energy, the major provider of electricity in Detroit, generated 7,537,732 MWh of electricity from the facilities that it directly owns and operates in Wayne County, resulting in emissions of over 6 million metric tons of CO2 of greenhouse gases, and hundreds of thousands of tons of other Criteria Air Pollutants that harm human health.
22% of DTE’s “renewable energy” comes from the Detroit incinerator (renamed “Detroit Renewable Power, LLC and indicated in yellow on the chart), which is the third largest source of electricity plant-generated carbon emissions in Wayne County.
In addition to improving air quality and helping electricity users save, energy efficiency and clean energy can help Michigan’s economy. After the RPS was passed, Michigan increased its capacity to generate renewable energy by nearly 7,000%, and 94% of it was from new local wind power (MI Manufacturers Association, MI Public Service Commission 2013). Michigan imports 97% of its petroleum needs, 82% of its natural gas, and 100% of coal and nuclear fuel from other states and nations. (“Michigan Energy Overview,” Michigan Public Service Commission October 2011).
Ann Arbor’s Energy Office has saved city taxpayers more than $5 million in energy expenditures over the last decade. It has also obtained and managed over $2 million in grants and rebates from federal, state, and corporate sources.
While renewable energy is often held to a high standard for cost competitiveness with fossil fuels, over a century of subsidies has led to cheaper price of fossil fuels. A 2011 report from the International Energy Agency stated that fossil fuels currently receive subsidies through some 250 mechanisms. In addition, a Harvard Medical School study found that the extra health and environmental costs of burning coal in the United States amount to $500 billion per year.
ENVIRONMENT & PUBLIC HEALTH
(Charts: Diabetes, Heart Disease and Cancer deaths per 10,000)
Heart disease, cancer and diabetes are bigger causes of death in Detroit than they are statewide or nationally.
Source: Center for Disease Control. 2010
Health starts where we live, learn, work, and play. We know that race and income contribute to health disparities, but it works the other way, too. Poor health can impair educational attainment and job opportunities. While gender, genetics, and access to health care play a contributing role in a person’s health, socioeconomic status and environmental conditions are key factors. For example, Detroit’s child asthma and lead poisoning rates are several times higher than the state or national rates. Asthma is a leading chronic cause of missed days for students and workers. Even low levels of lead poisoning in children have been shown in multiple studies to lower IQs, increase aggression and ADHD, and are linked to juvenile delinquency. Air pollution called PM2.5 (which comes from vehicles, power plants, and other combustion activity) has been linked with mortality and heart problems. While we can take individual actions to reduce these health risks, it is our policy-makers’ responsibility to make and enforce regulations that protect air, water, and land quality.
(Image: Particulate Matter and Greenhouse Gas Emissions by Facility)
Before you eat that fish…
The Detroit River, along with 42 other waterways in the Great Lakes, is considered an “Area of Concern.” Industrial pollutants such as mercury, PCBs, and dioxins land in our waterways and are absorbed by fish. When people eat the fish, they absorb the toxins in the fish; therefore, we now have restrictions on fish and wildlife consumption.
Mercury, which comes from coal-burning power plants and other industrial processes, damages the brain and nerves, especially in a fetus or a young child. Pregnant women, nursing mothers, young children, and women who may become pregnant should avoid eating fish high in mercury. PCBs are now banned in the U.S. for their toxicity, but remain in our environment, and cancer-causing dioxins come from diesel combustion and incineration.
Yellow perch and bluegill are the lowest in chemicals and safest to eat. Catfish and carp, which feed off the bottom where most of the chemicals are found, have more chemicals in their bodies than any other fish in the Detroit River – those fish, and whitefish larger than 22 inches, are not safe to eat.
After surveying 115 and interviewing 78 anglers along the Detroit River, a 2008 UM master’s project found that only 53% were aware of correct fish advisory content (see graphic right); 48.7% reported awareness but had incorrect or no information about the advisory. It also found that older Detroiters perceived the River to be of higher water quality and were more likely to take home fish to eat. (Source: Kalkirtz, Martinez, & Teague. “Environmental Justice and Fish Consumption Advisories on the Detroit River Area of Concern.” UM School of Natural Resources and Environment 2008)
(Image: Going Fishing?)
Source: http://www.miseagrant.umich.edu/downloads/fisheries/detroitriver/Brochure-Eat-Safe-Fish-in-the-Detroit-Area.pdf
(Image: Contaminated Fish by District)
Although lack of clarity in the question may have contributed to the survey’s highest percentage of “I don’t know” responses (32% overall), over 1/4 of survey respondents in all 7 districts were unsure of the seriousness of contaminated fish.
For more information about fish safety, request a free copy of the Eat Safe Fish Guide from the Michigan Department of Community Health (800-648-6942).
(Image: Asthma Hospitalizations by Zip Code)
(Image: Asthma by District)
In every district but District 6 and District 7, which identified asthma as a top 10 environmental problem, more than a quarter of survey respondents did not know the seriousness of asthma in their neighborhood.
The tri-county Asthma Hospitalizations by Zip Code map to the left shows that asthma rates are significantly higher in Detroit compared to the rest of the region, and the areas of highest rates cover nearly all of the Districts 3 and 5. District 6 may not show up as high in hospitalizations if the population there does not go to the hospital for asthma attacks.
2011 Michigan Behavior Risk Factor Survey data below show that Detroit’s adult asthma rates are much higher than the state rate. The Michigan Department of Community Health is currently in the process of updating the 2010 report on “Detroit, the Epicenter of the Asthma Burden,” which will include child asthma prevalence.
Adults who were ever told they had asthma:
- City of Detroit: 22%
- Michigan: 15%
Adults who currently have asthma:
- City of Detroit: 17%
- Michigan 10%
AIR POLLUTION FROM FACILITIES
Detroit is home to 55 facilities that have to get special state permission to operate because of their air emissions (2008 National Emissions Inventory). Two of them are considered “high priority violators,” including Marathon Oil Refinery, which was approved for a 20-year $176 million tax exemption and $10 million in brownfield tax credits by our local elected officials.
Exposure to these air toxins affect developmental, cardiovascular, respiratory, and neurological health, contributing to Detroit’s high rates of cancer, asthma, and heart disease.
A University of Michigan of study analyzed all reported chemical air emissions for their toxicity to human health and nearby exposures to those chemicals. Their study found that Detroit is home to five of the top 25 most polluted zip codes in the state, including 48217 at #1.
48217 had a toxic burden score of 2576, which is 46x the state average.
While State and Federal authorities have jurisdiction over air permits, the City can play a role in improving air quality by thinking about land use and zoning. We can decide how much land to dedicate towards land uses that involve heavy air (and other) pollution, and what kinds of mitigation measures such as minimum distances and visual, noise, and pollution buffers will be required in order to protect nearby residential areas.
According to EJView, the Environmental Protection Agency’s interactive, online mapping tool, Detroit is in “nonattainment areas” for ozone and fine particulate matter. That means Detroit’s air quality does not meet EPA standards for those two pollutants.
AIR POLLUTION FROM TRUCKS
Diesel emissions are a likely carcinogenic, worsen asthma attacks, exacerbate allergies, and contribute to ground-level ozone. Because of Detroit’s importance as an international port, we have tens of thousands of trucks daily on our major corridors, with 70-90,000 trucks daily on I-75, I-94, I-96, 7 Mile, and M39. Michigan only regulates truck routes to protect pavement, not public health. Detroit does not have a local ordinance designating truck routes, but does have a local ordinance that prohibits truck from driving through areas with posted signs. New diesel vehicles (post-2007 EPA standards) are 90% cleaner than older models.
(Chart: Toxic burden score)
Database: Detroit Free Press “Toxic ZIP code rankings.”
Data source: University of Michigan professors Paul Mohai, Byoung-Suk Kweon, Sangyun Lee, Kerry Ard; Environmental Protection Agency