Click here for the full Environment & Public Safety section
SEE FULL TEXT BELOW:
ENVIRONMENT & PUBLIC SAFETY
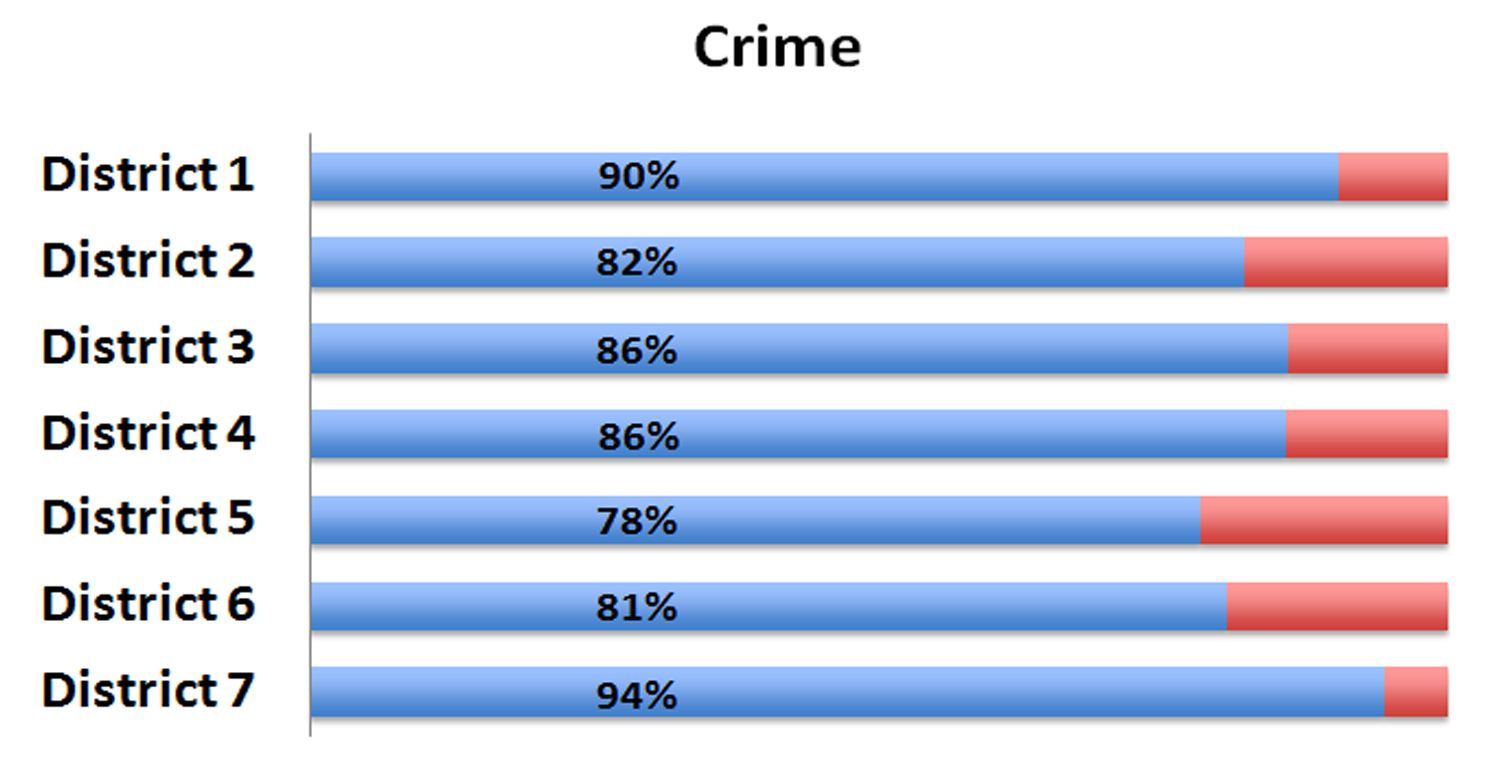
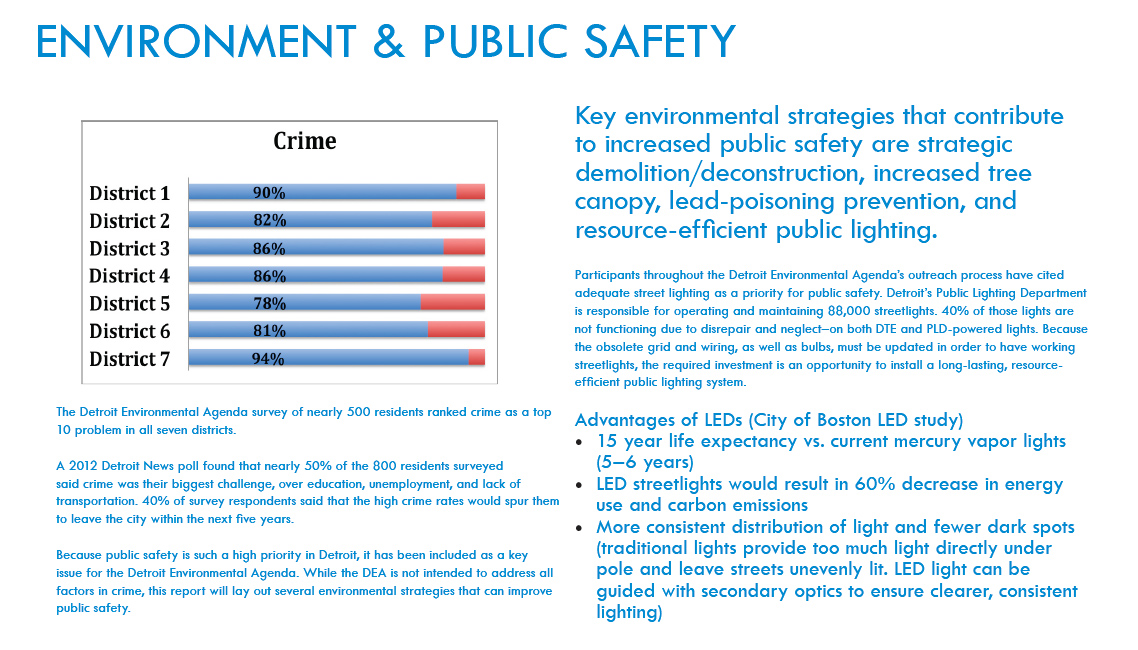
The Detroit Environmental Agenda survey of nearly 500 residents ranked crime as a top 10 problem in all seven districts.
A 2012 Detroit News poll found that nearly 50% of the 800 residents surveyed said crime was their biggest challenge, over education, unemployment, and lack of transportation. 40% of survey respondents said that the high crime rates would spur them to leave the city within the next five years.
Because public safety is such a high priority in Detroit, it has been included as a key issue for the Detroit Environmental Agenda. While the DEA is not intended to address all factors in crime, this report will lay out several environmental strategies that can improve public safety.
Key environmental strategies that contribute to increased public safety are strategic demolition/deconstruction, increased tree canopy, lead-poisoning prevention, and resource-efficient public lighting.
Participants throughout the Detroit Environmental Agenda’s outreach process have cited adequate street lighting as a priority for public safety. Detroit’s Public Lighting Department is responsible for operating and maintaining 88,000 streetlights. 40% of those lights are not functioning due to disrepair and neglect – on both DTE and PLD-powered lights. Because the obsolete grid and wiring, as well as bulbs, must be updated in order to have working streetlights, the required investment is an opportunity to install a long-lasting, resource-efficient public lighting system.
Advantages of LEDs (City of Boston LED Study)
– 15 year life expectancy vs. current mercury vapor lights (5-6 years)
– LED streetlights would result in 60% decrease in energy use and carbon emissions
– More consistent distribution of lights and fewer dark spots (traditional lights provide too much light directly under pole and leave streets unevenly lit. LED light can be guided with secondary optics to ensure clearer, consistent lighting)
Source: Raleigh & Galster “Neighborhood Disinvestment, Abandonment and Crime Dynamics” WSU 2013
– 78,000 Vacant structures
– 38,000 Dangerous buildings
– 11,000-12,000 fires annually in past decade
60% of fires occur in blighted or unoccupied buildings. Vacant homes quickly become abandoned homes in unaddressed.
Source: 2013 EM Report to Creditors, Detroit Free Press
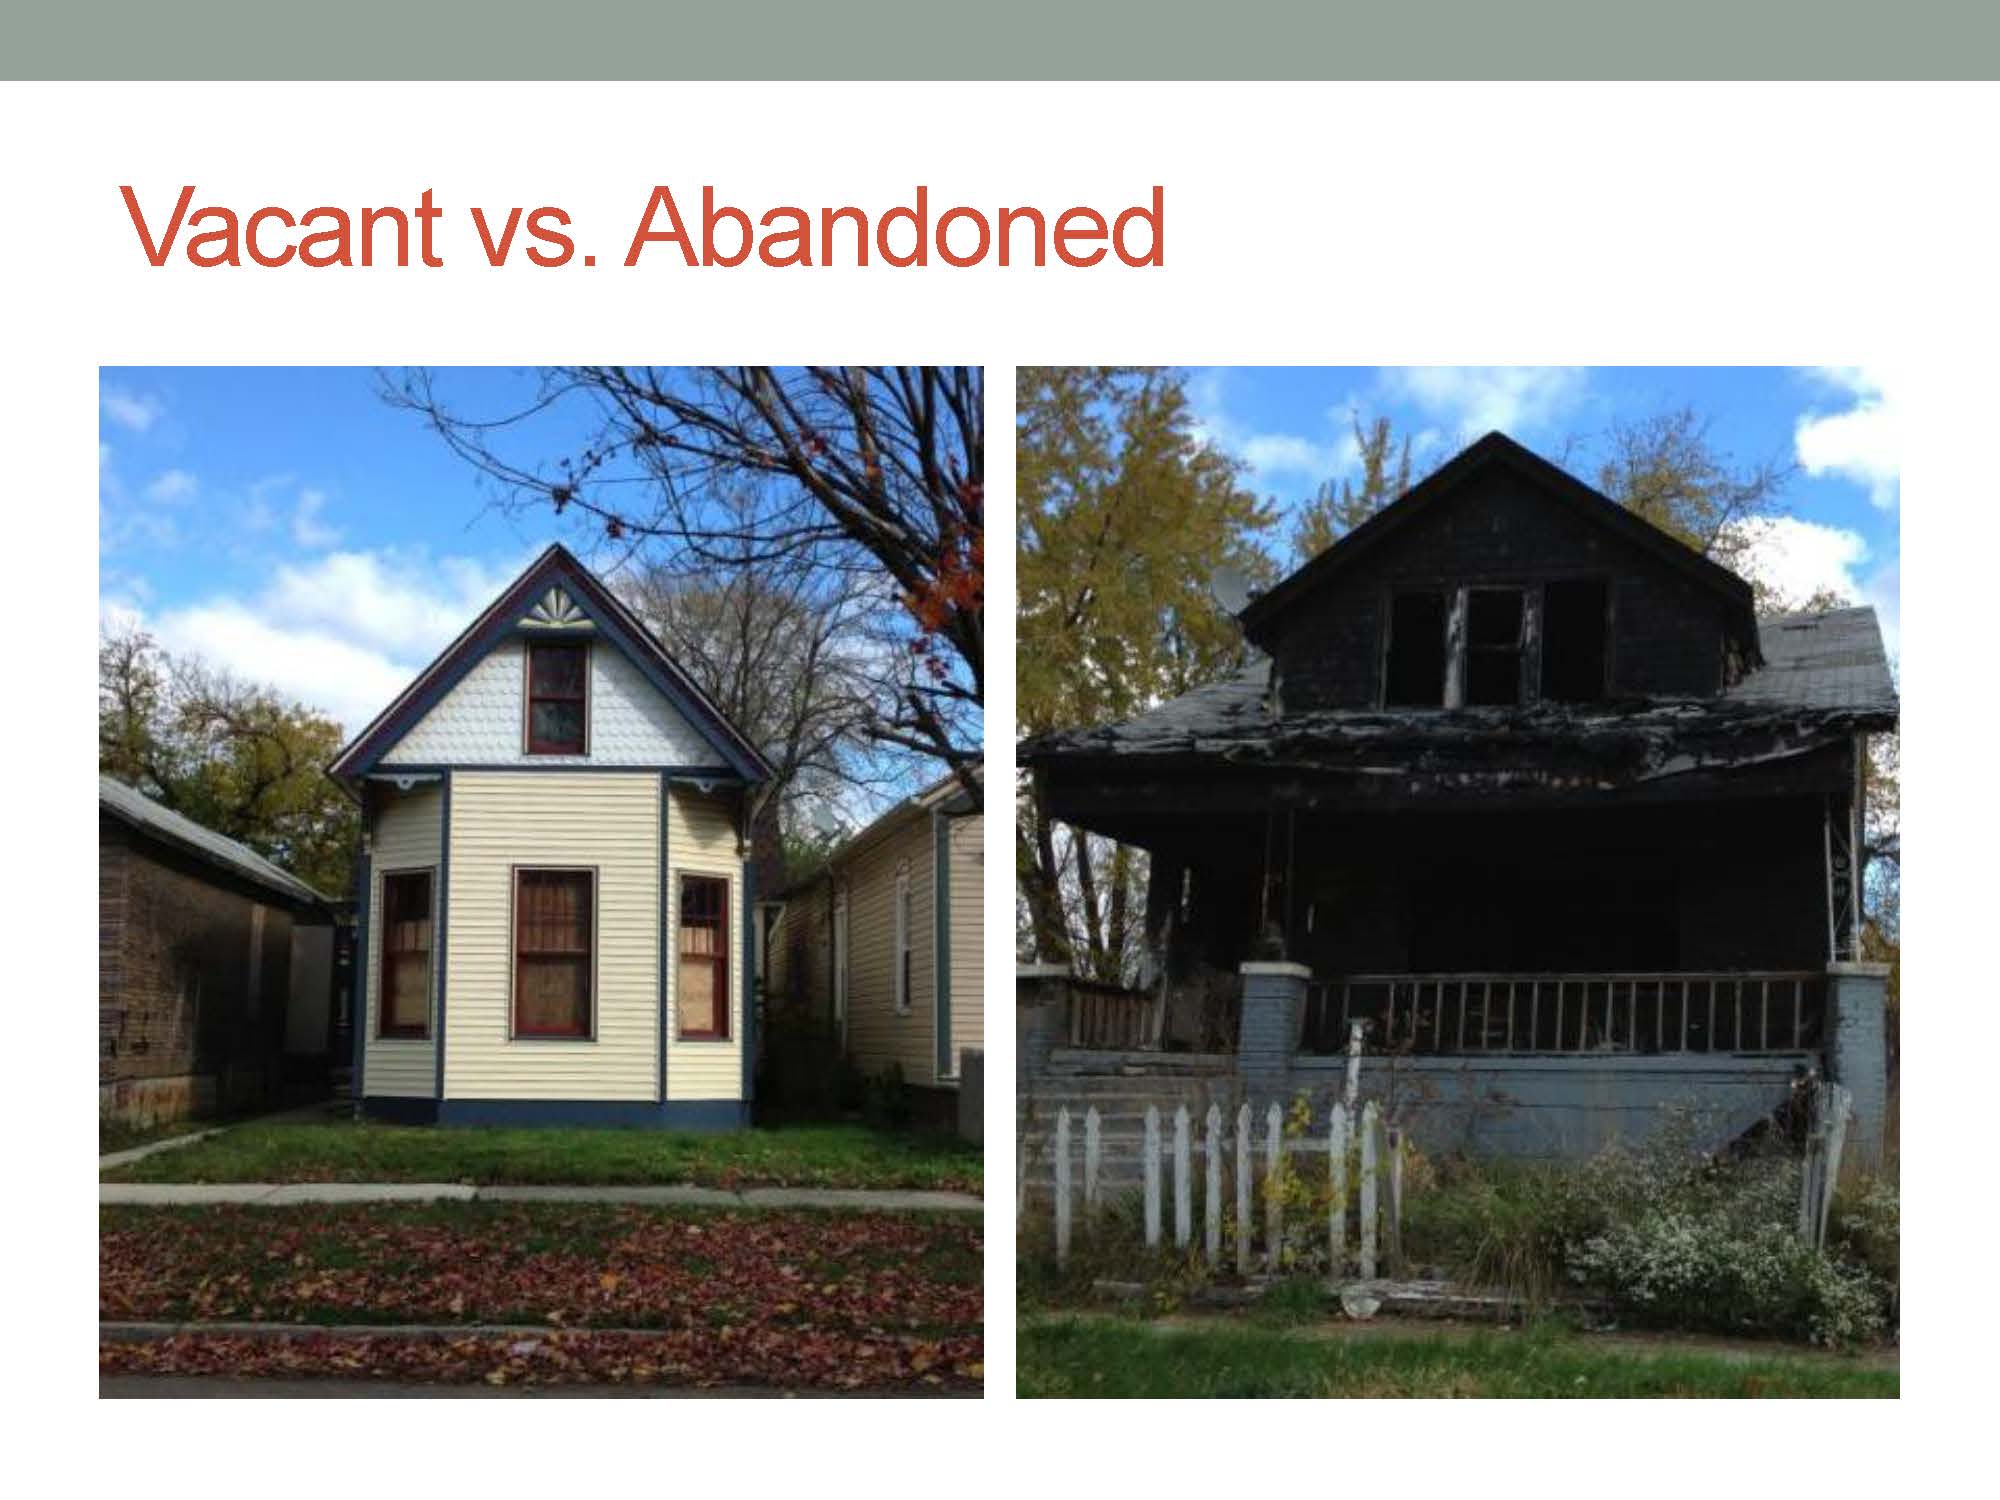
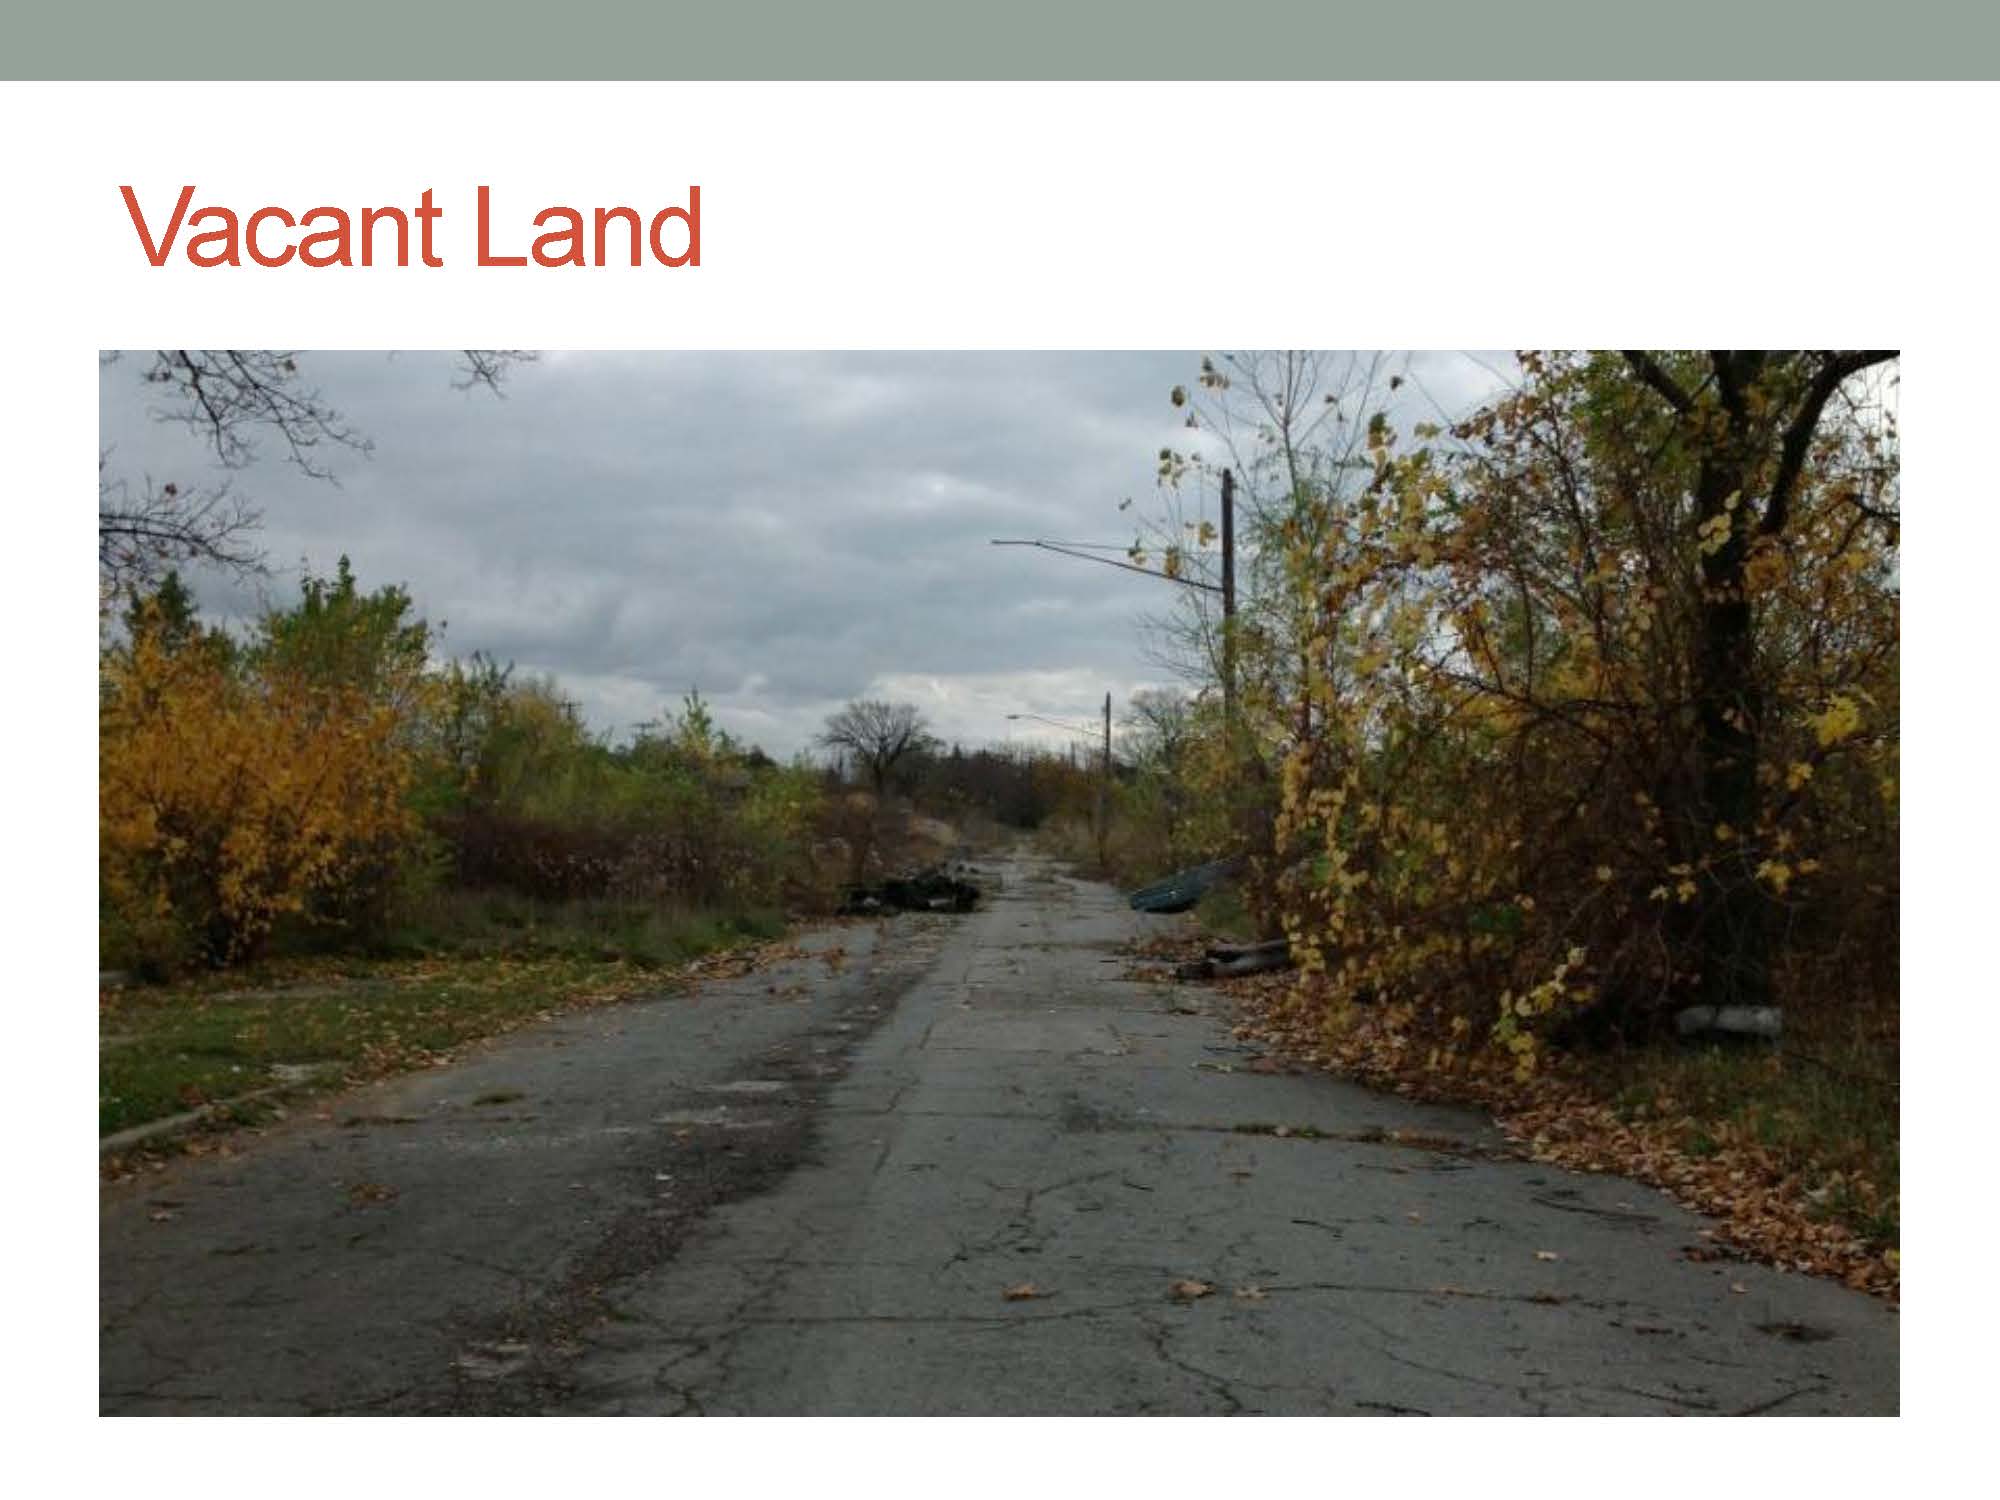
A 2013 Wayne State University study found that while intact vacant houses were correlated to crime activity, abandoned structures (such as those fire damaged beyond repair) were less correlated to crime, and vacant land with no structure even less so. According to the study, recent foreclosures may be a more likely attracter of criminal activity than the fire-damaged or VOD buildings. Further study should be conducted to determine whether the following safety recommendations are viable:
– Prioritize vacant yet intact houses for reoccupation in stable neighborhoods for public safety. Keeping homes occupied can reduce crime attracted to vacant houses.
– Prioritize for architectural salvage and deconstruction vacant yet intact houses that are isolated and in areas that the community designates for alternative use.
– Prioritize for rapid, geographically grouped, environmentally safe demolition of severely damaged properties to increase walkability, perception of safety, decrease pressure on the fire department, and preserve property values and neighborhood quality of life.
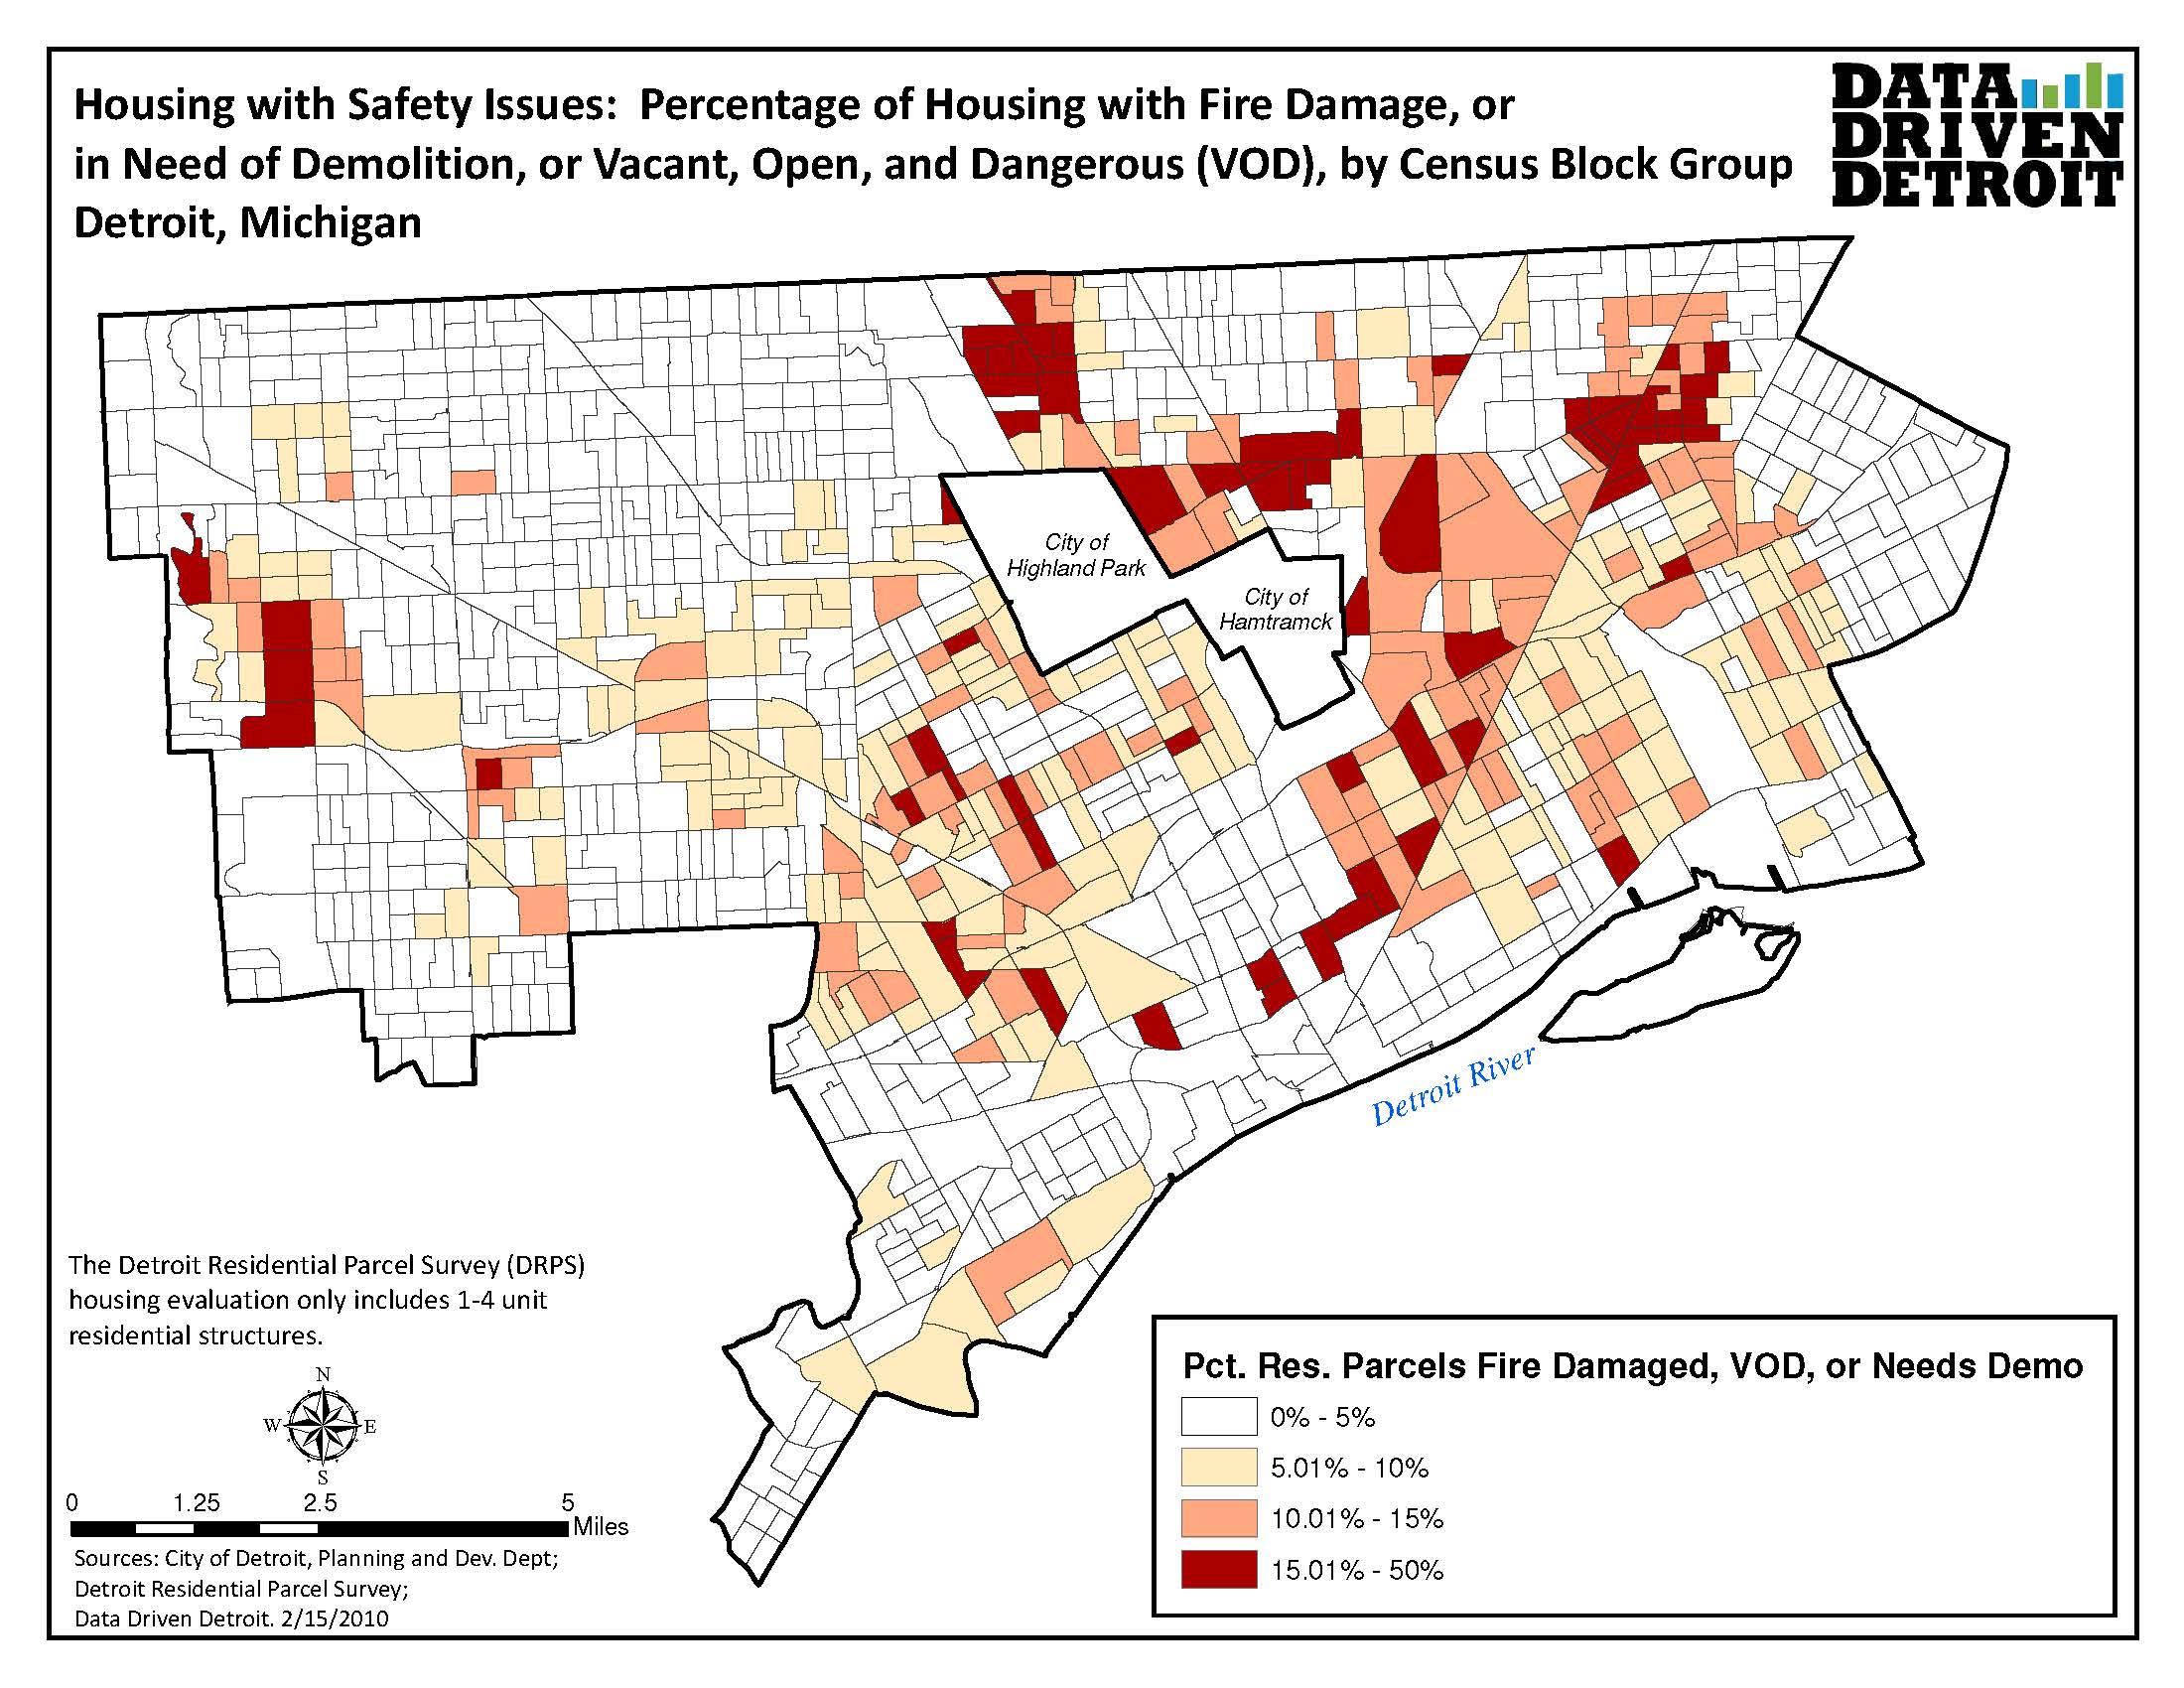
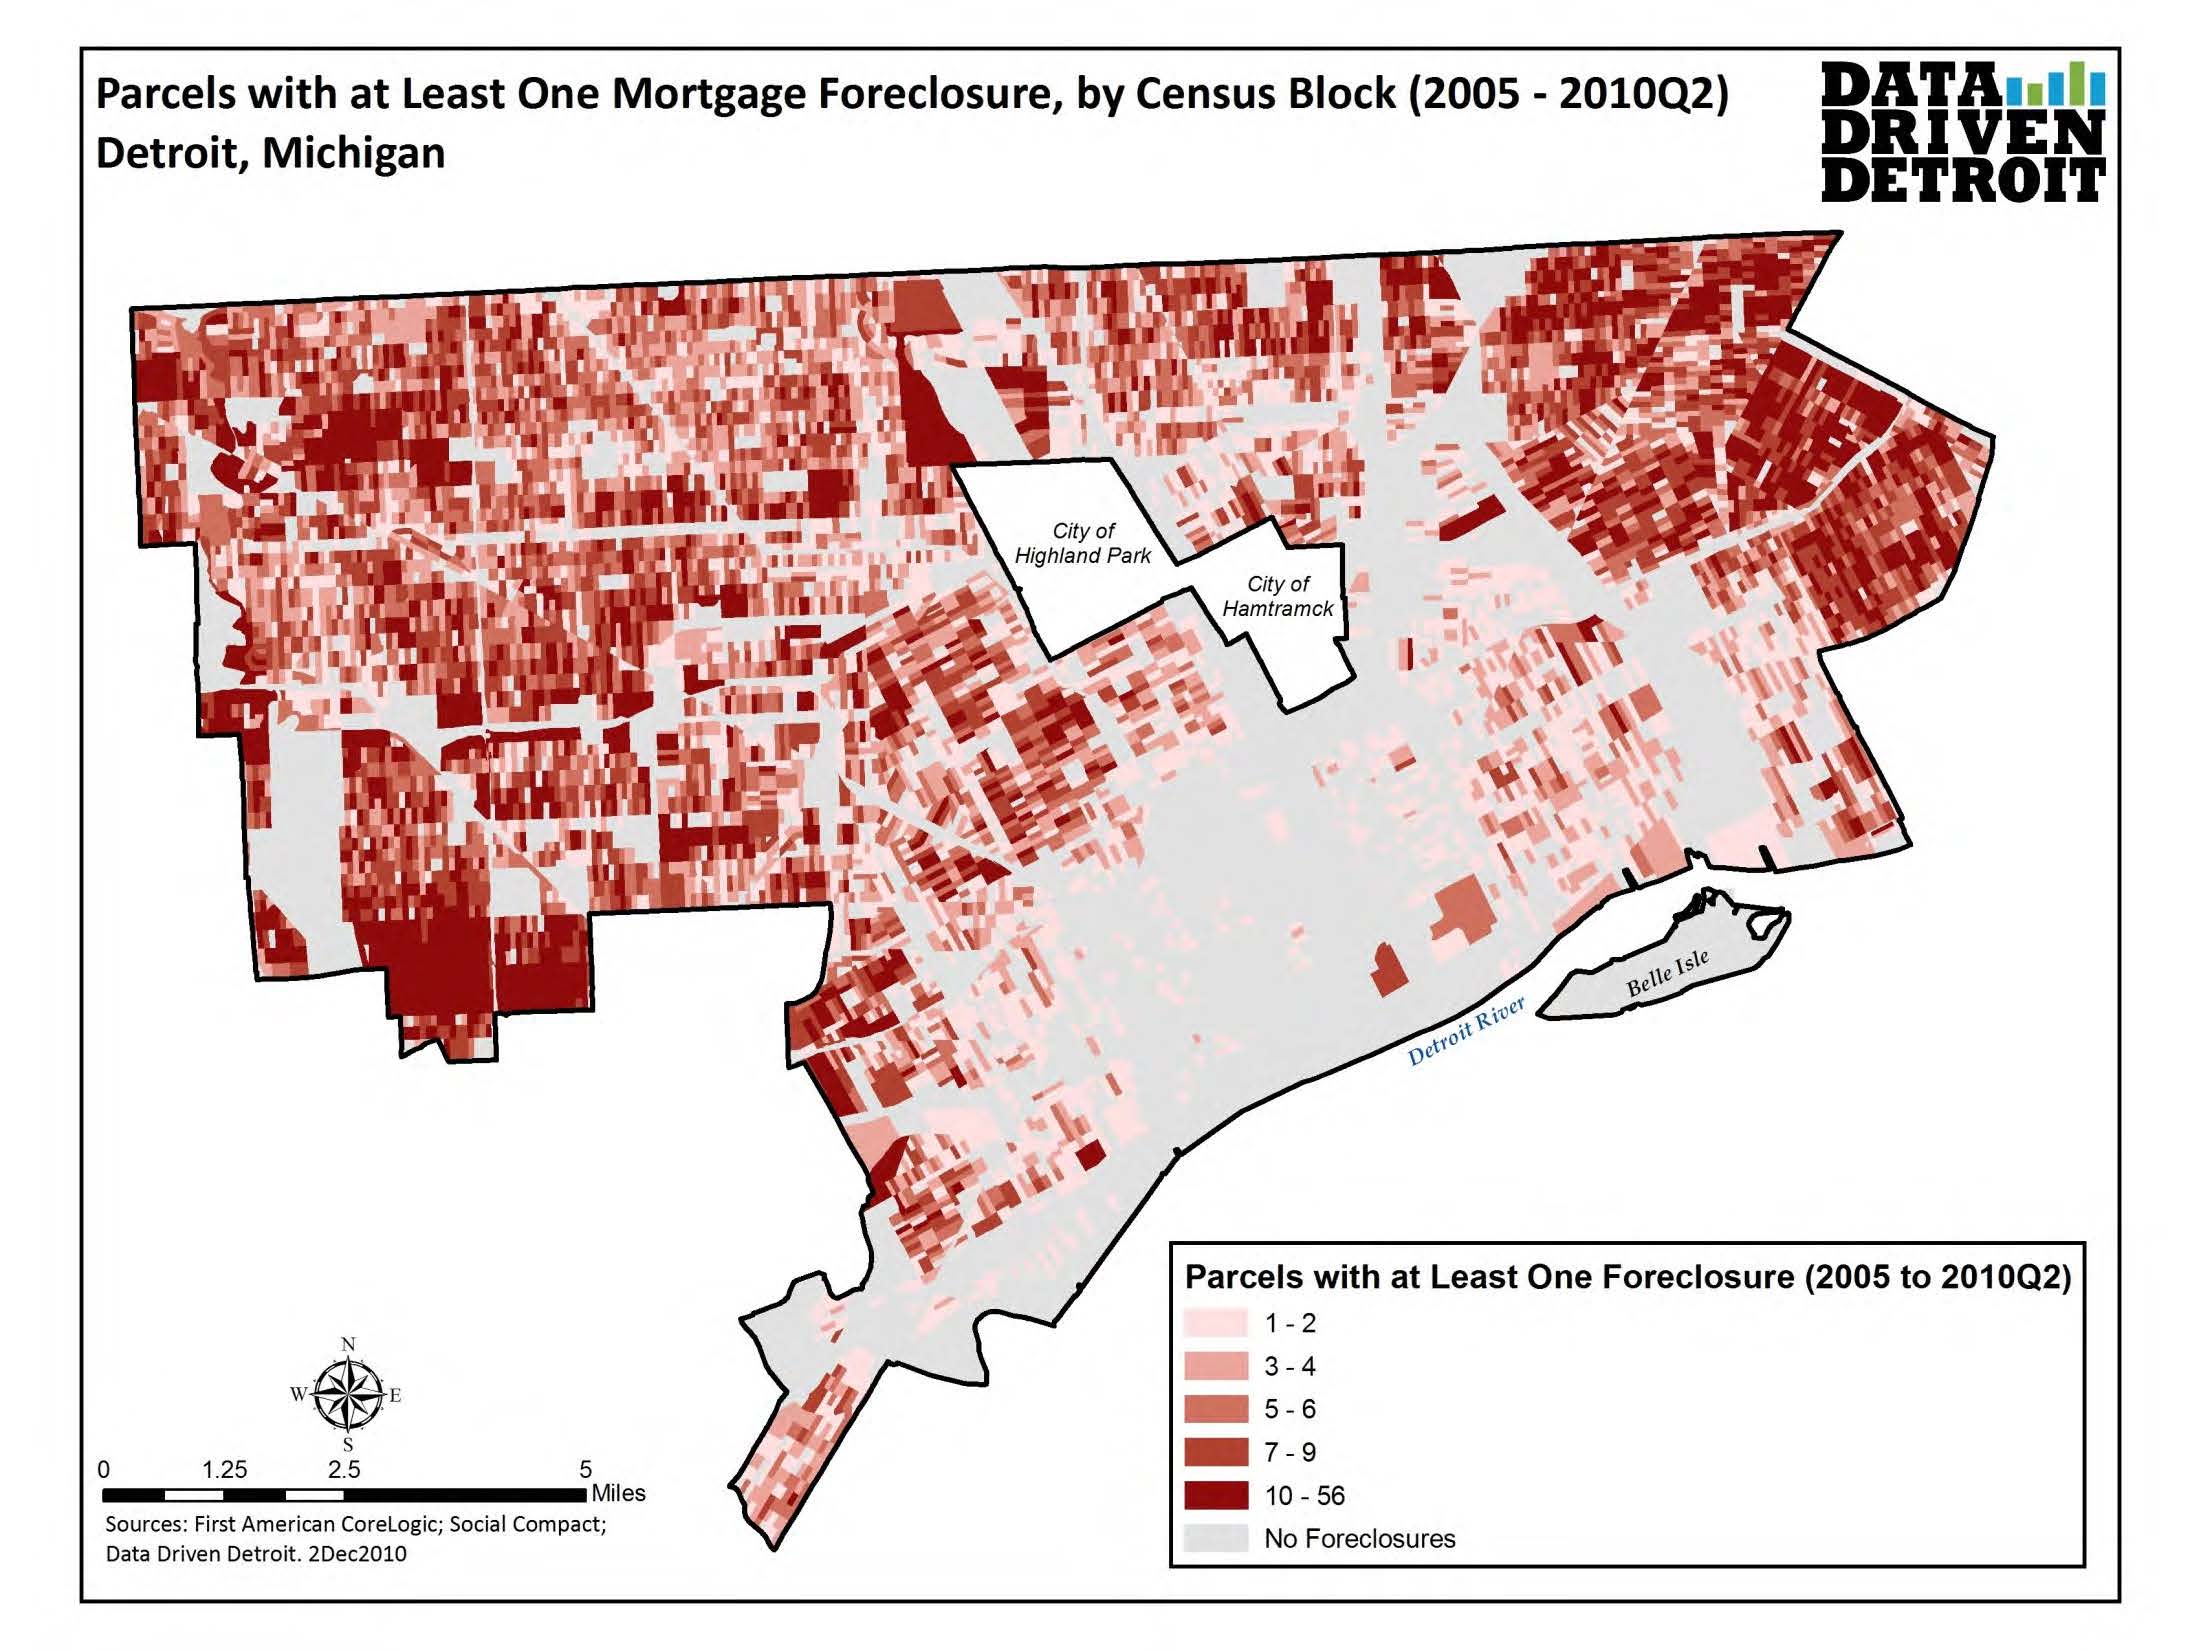
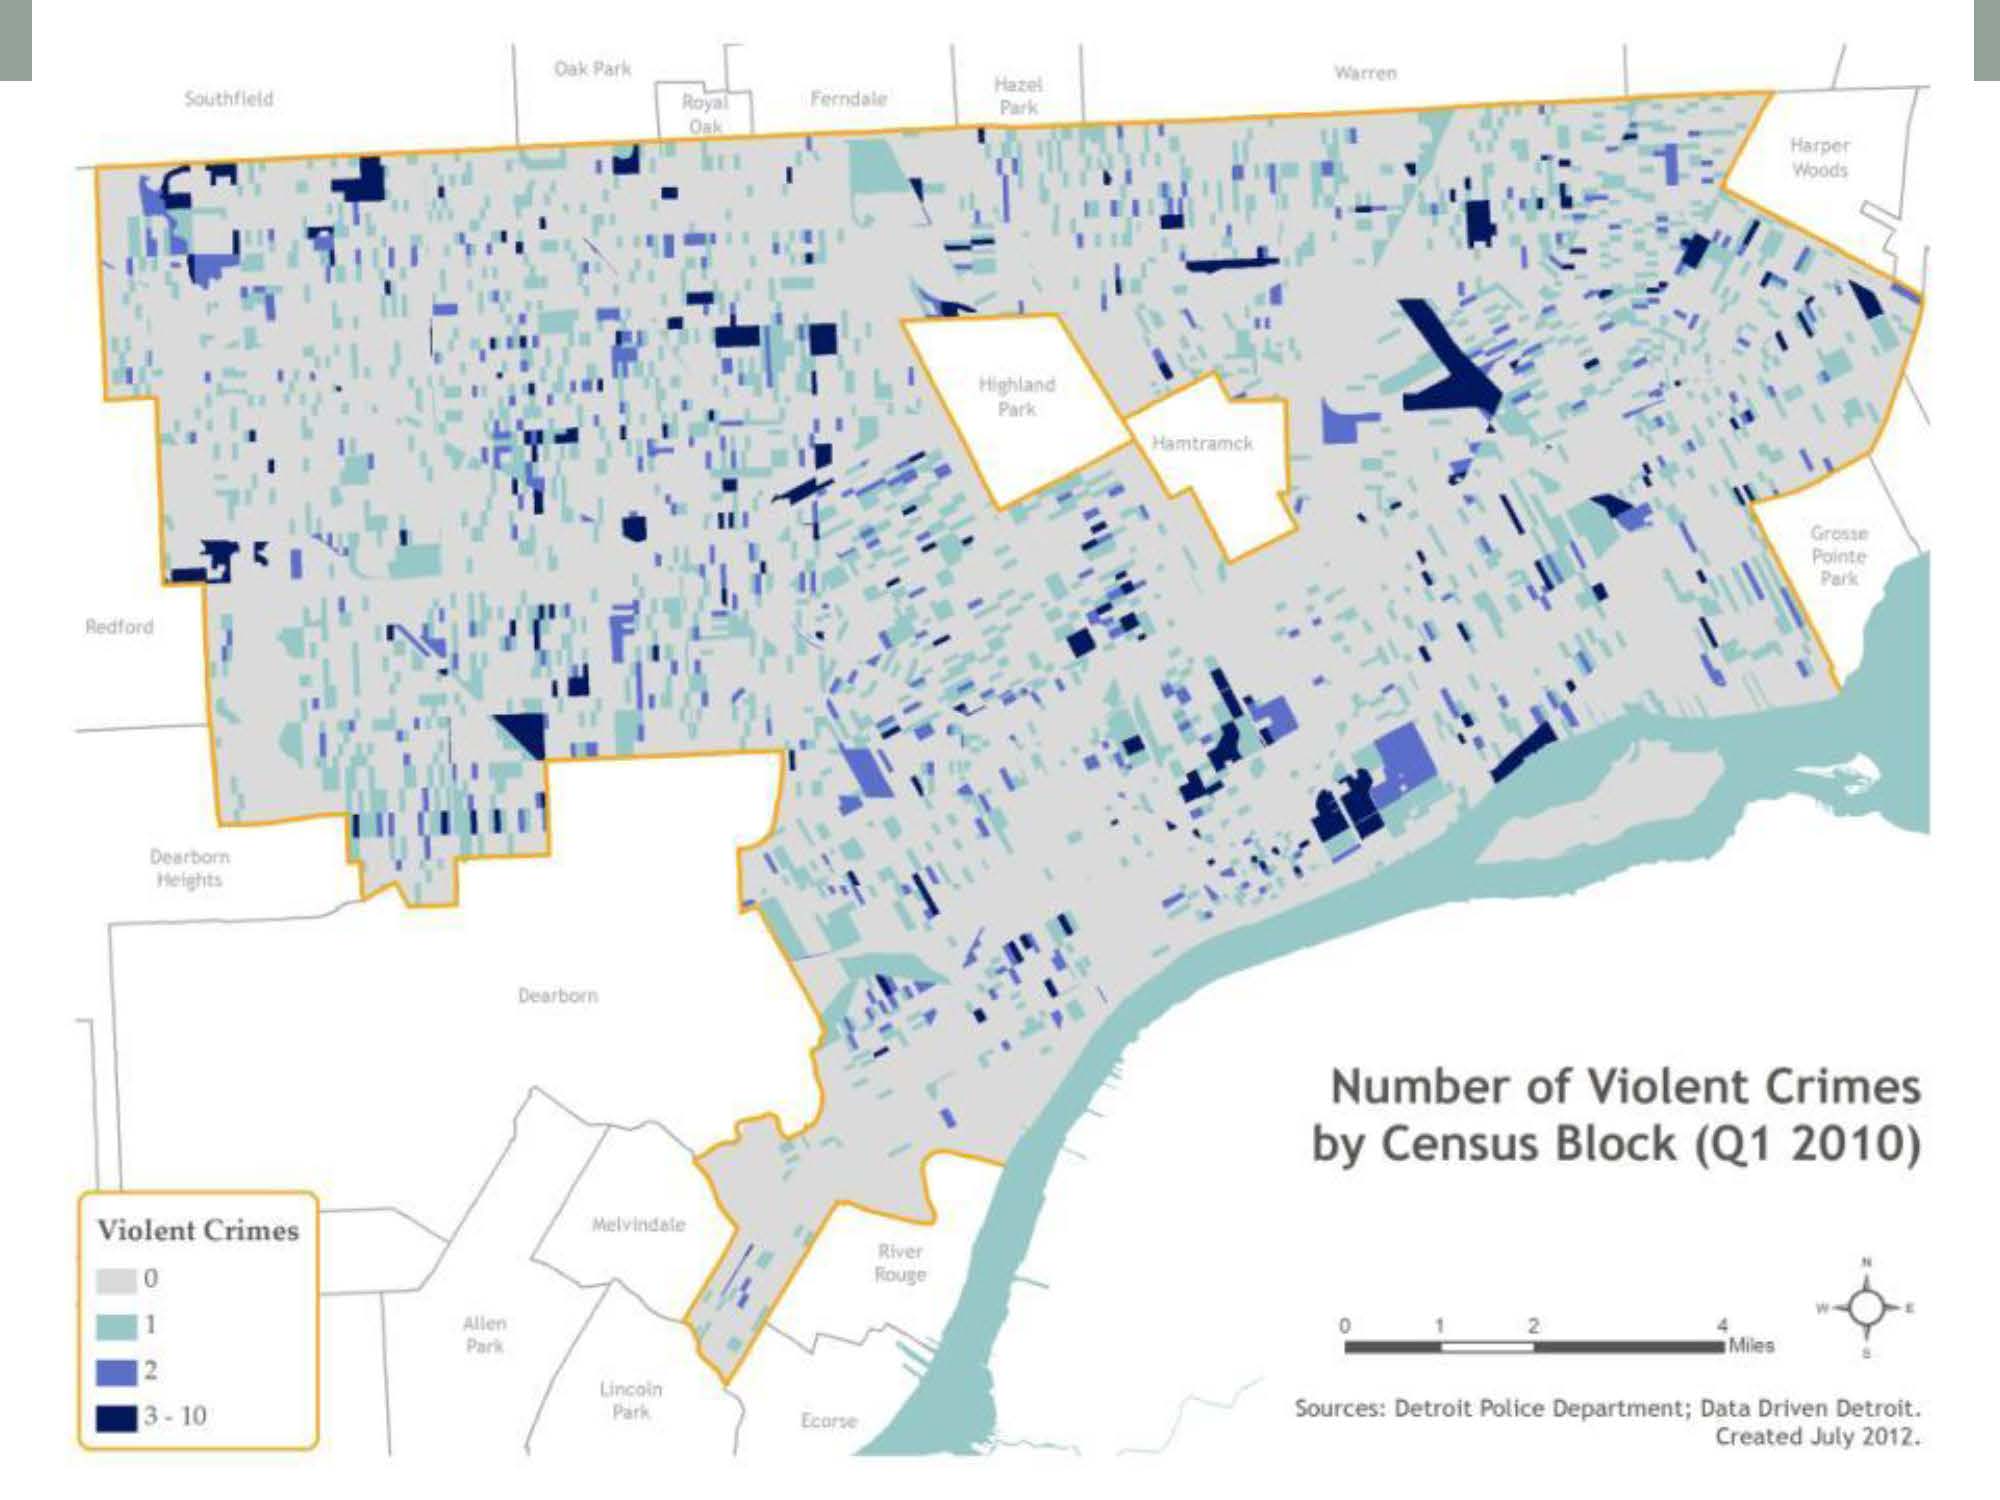
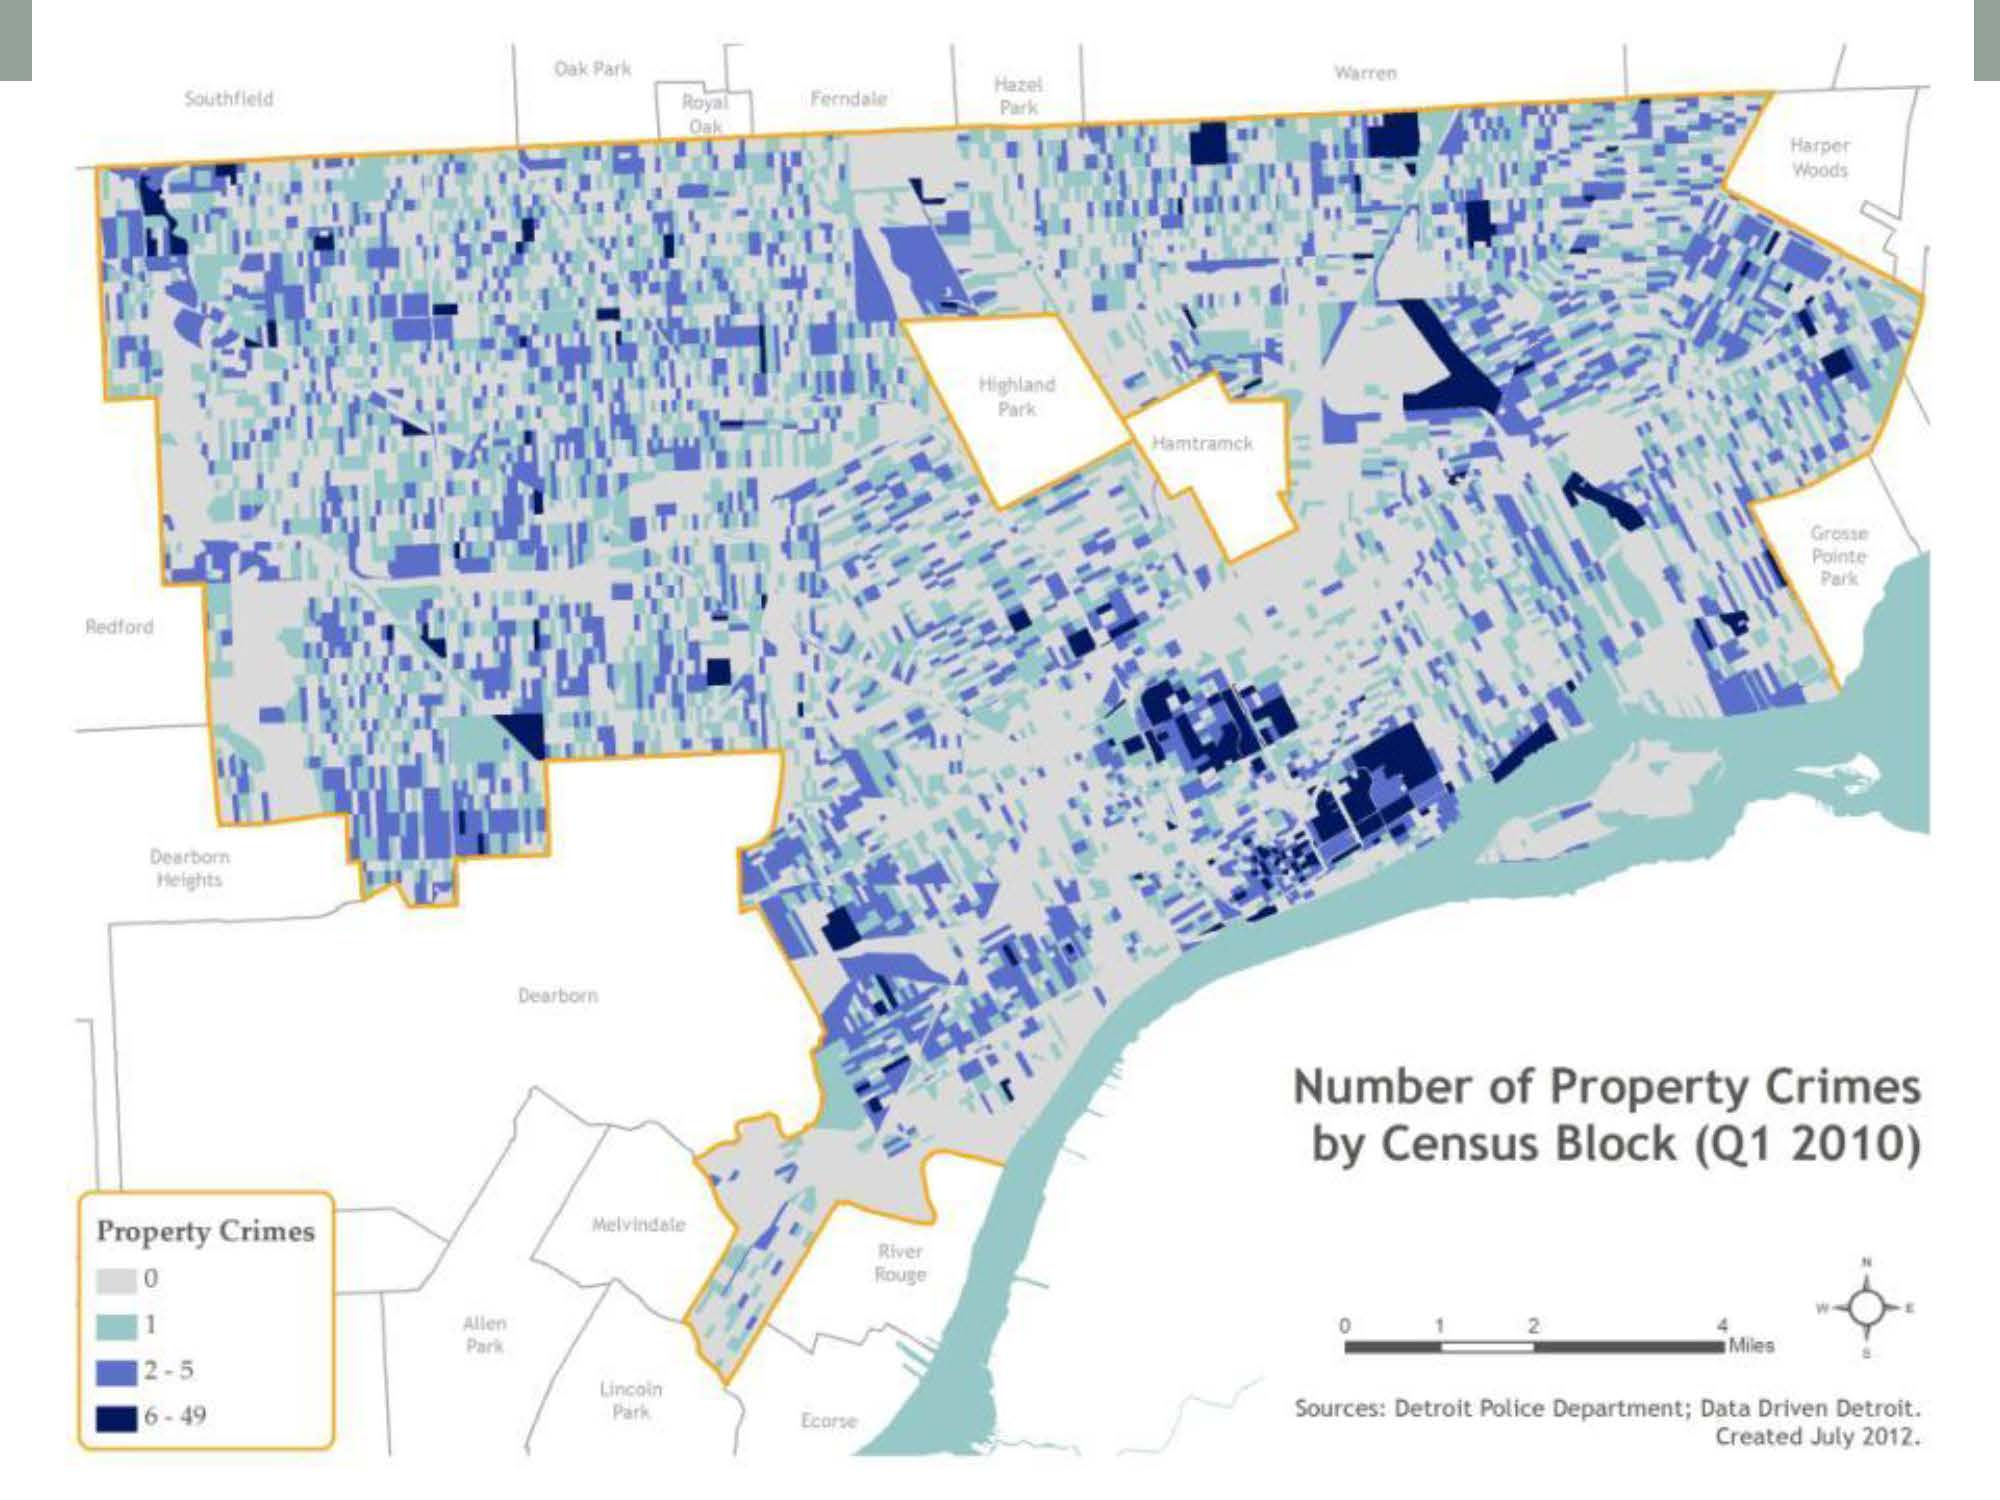
Compare locations of violent crime (assault, robbery) and property crime (burglary, destruction/vandalism, drug/narcotics, larceny, motor vehicle theft) in the first quarter of 2010 (see maps to right) to 2009 housing conditions (upper left) and 2005-2010 mortgage foreclosures (lower left). A recent WSU study currently under peer review found that crimes more frequently occurred on blocks with higher renter occupancy, more liquor licenses, lower population density, and more crime on adjacent blocks (Galster & Raleigh 2013).
More Trees, Less Crime
After nine months of data analysis on 2,813 homes in a Portland, Oregon, neighborhood that experiences a crime rate of 50% higher than the national average, the U.S. Forest Service found that tree-lined streets and yards with larger trees were linked with lower property crime and violent crime rates. The study controlled for over 24 other variables such as size, age, value, condition of the house, types of barriers, and presence of a neighborhood watch, burglar alarm, dog, or bars on the windows.
A Baltimore study of the urban tree effect found that a 10% increase in neighborhood trees roughly corresponded with a 12% decrease in crime.
Because trees also help cool the city, filter air pollution, reduce stress on the sewer system, and beautify a neighborhood, increasing the urban tree canopy is a multipurpose strategy for improving public safety.
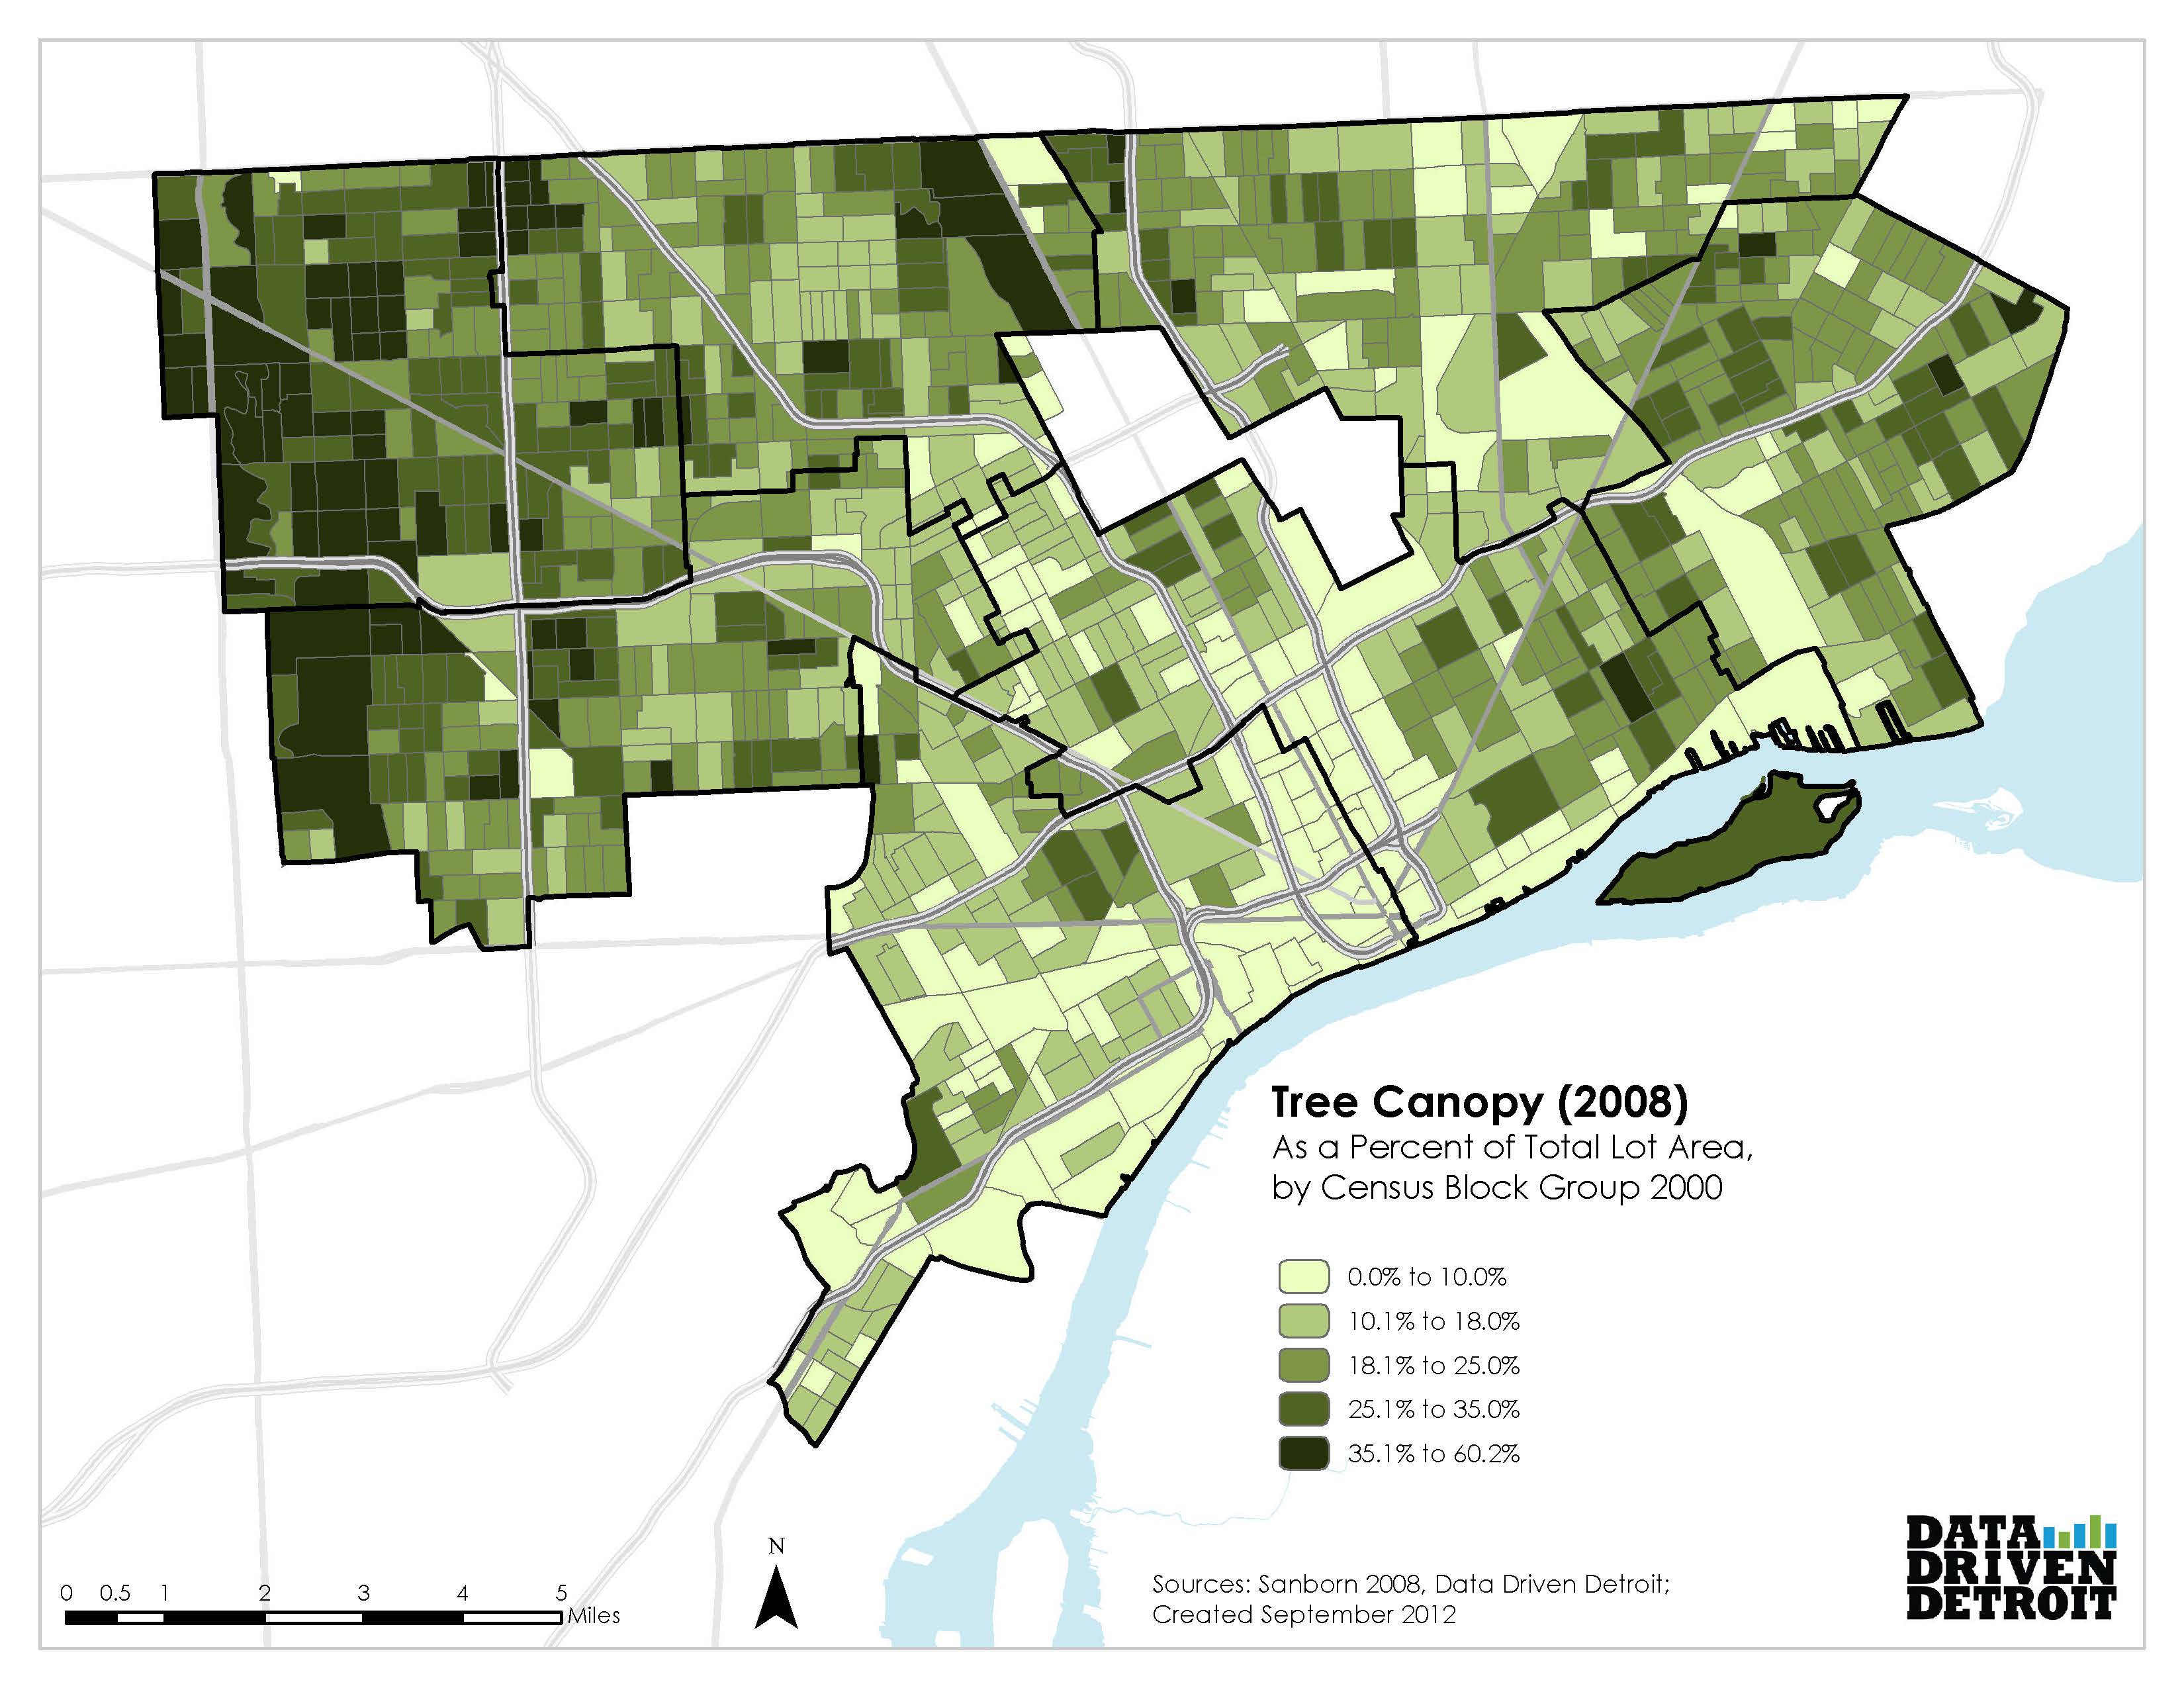
Southwest Detroit has the lowest percentage of tree canopy.
Detroit’s tree canopy is only 22.5% overall, compared to a national average of 27% and Atlanta’s 36% (highest of all major cities). American Forests recommends 40% tree cover for cities east of the Mississippi.
Detroit’s tree canopy is lower than both the national average and the recommended percentage for cities.
Detroit lost 500,000 trees between 1950 and 1980 to dutch elm disease, urban expansion, or neglect. A new invasive pest in 2002, emerald ash borer, decimated the city’s ash trees, which had been planted to replace lost elm trees. The Greening of Detroit has teamed up with community and volunteer groups to plant 70,000 trees in Detroit since 1989.
Sources: “The Effect of Tree on Crime in Portland, Oregon.” US Forest Service. 2011; “The Relationship between Tree Canopy and Crime Rates across an Urban-rural Gradient in the Greater Baltimore Region.” University of Vermont. Landscape and Urban Planning. 2011; “Tree Cover % – How Does Your City Measure Up?” www.deeproot.com. Info from Watt & Gunther, New York City Department of Parks. 2010.
Lead poisoning has been linked with crime in multiple studies over the past several decades. A longitudinal study in Philadelphia followed 497 black males from birth to age 24, studying 150 variables that could contribute to later criminal behavior. After adjusting for other factors such as poverty, presence of a father, race, education, etc., the only variable independently linked to adult criminal behavior, juvenile criminal behavior, and school misbehavior was childhood lead poisoning.
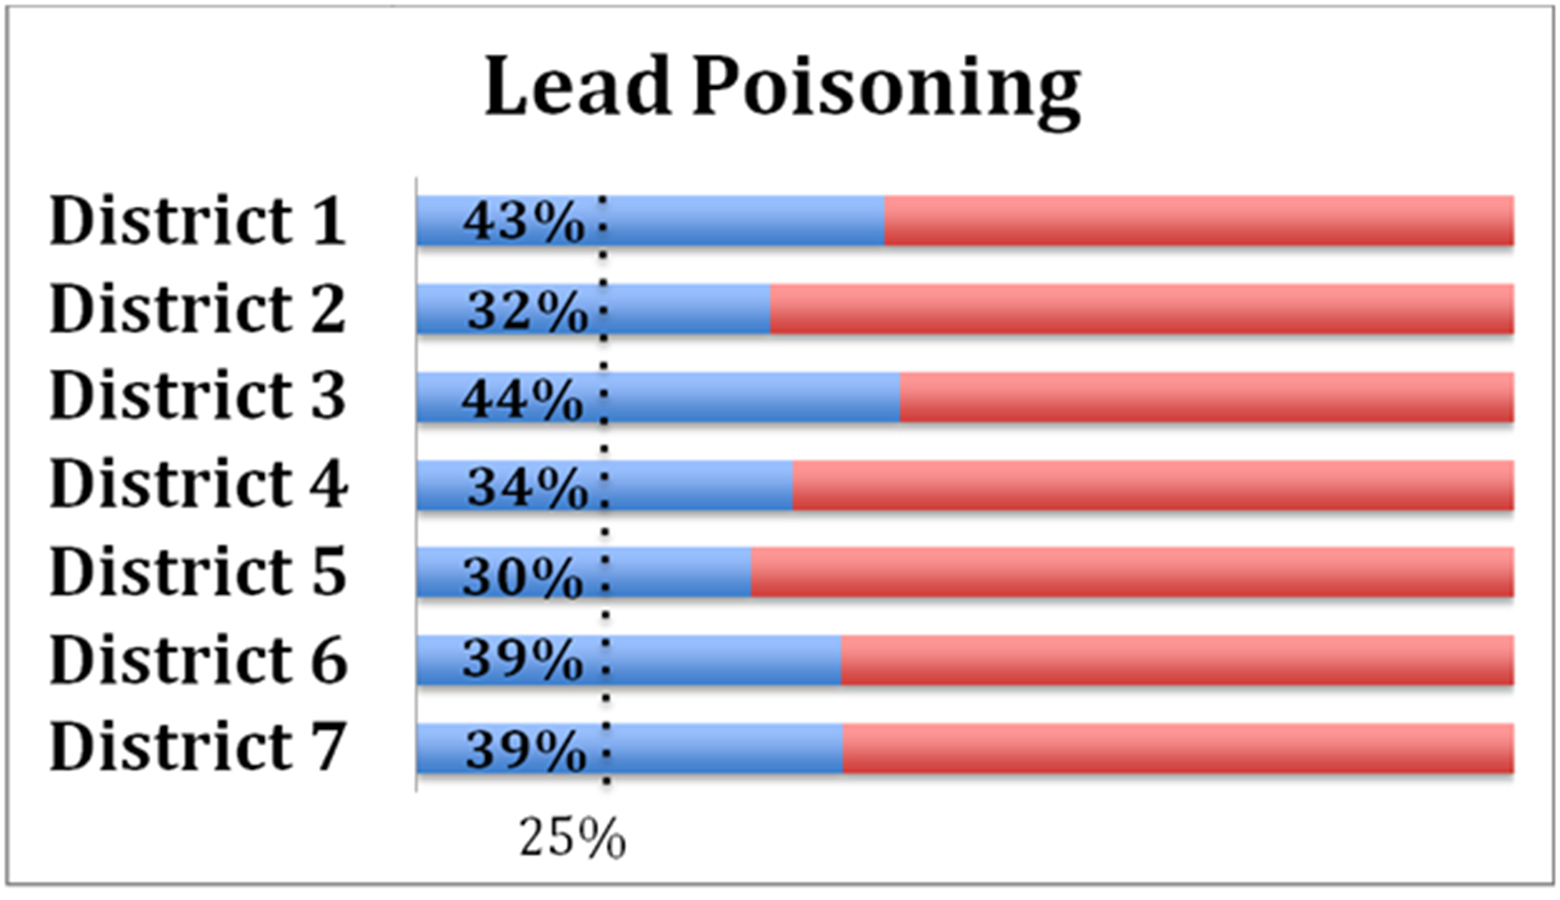
Along with the rest of the nation, Detroit’s lead poisoning rate has declined since the 1990s when the federal government began to invest in lead poisoning prevention. However, lead poisoning is indeed a serious issue in Detroit, with child lead poisoning rates several times higher than that of the state and the nation (see map to right). We have lead contamination in Detroit from several key sources – current and historic industrial activity that is the source of air deposition of lead, housing built before lead-based paint was banned in 1978 (over 90% of all low-income Detroit housing), and ground contamination from vehicle emissions running on leaded gasoline before that was phased out in the 1990s. As indicated in the image above, over 25% of survey respondents in all seven districts did not know if lead poisoning was a serious issue in their neighborhood. In the lead poisoning hot spot analysis below, red indicates higher hot spot scores, while blue indicates lower hot spot scores. District 3, 4, 5 and 6 have significant hot spots of children with high blood lead levels.
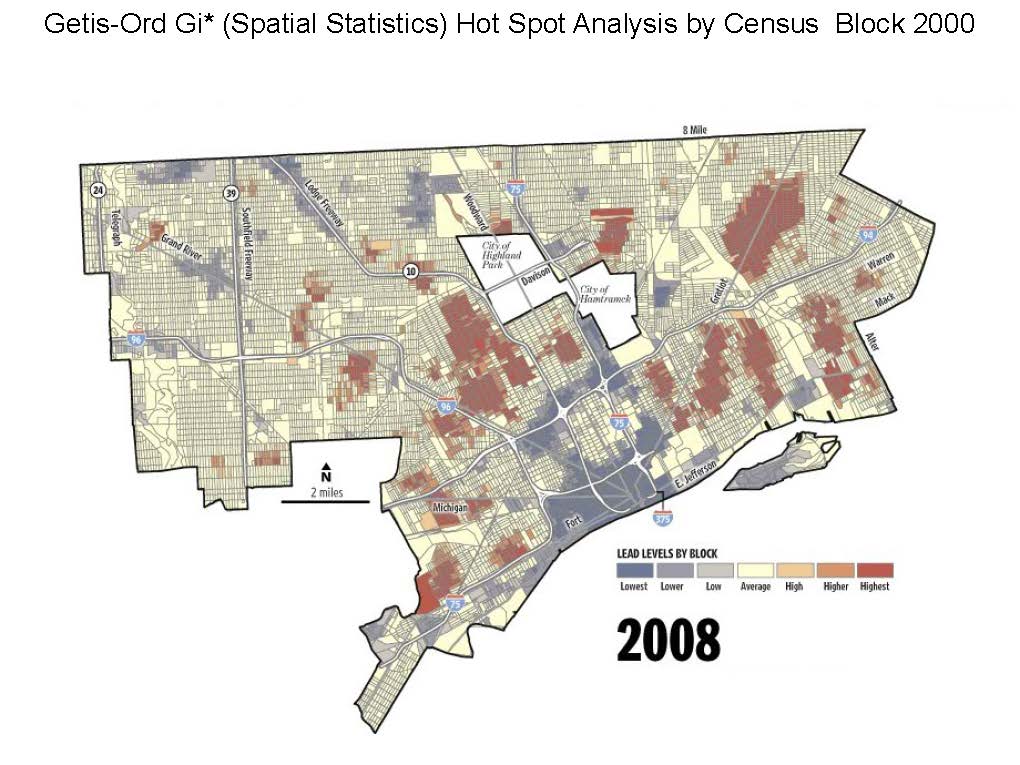
Source: Detroit Public Schools and Detroit Dept of Health and Wellness Promotion 2010 (1.Getis-Ord Gi*)
Detroit Free Press Soil Samples – Shelby Township vs. Northeast Detroit
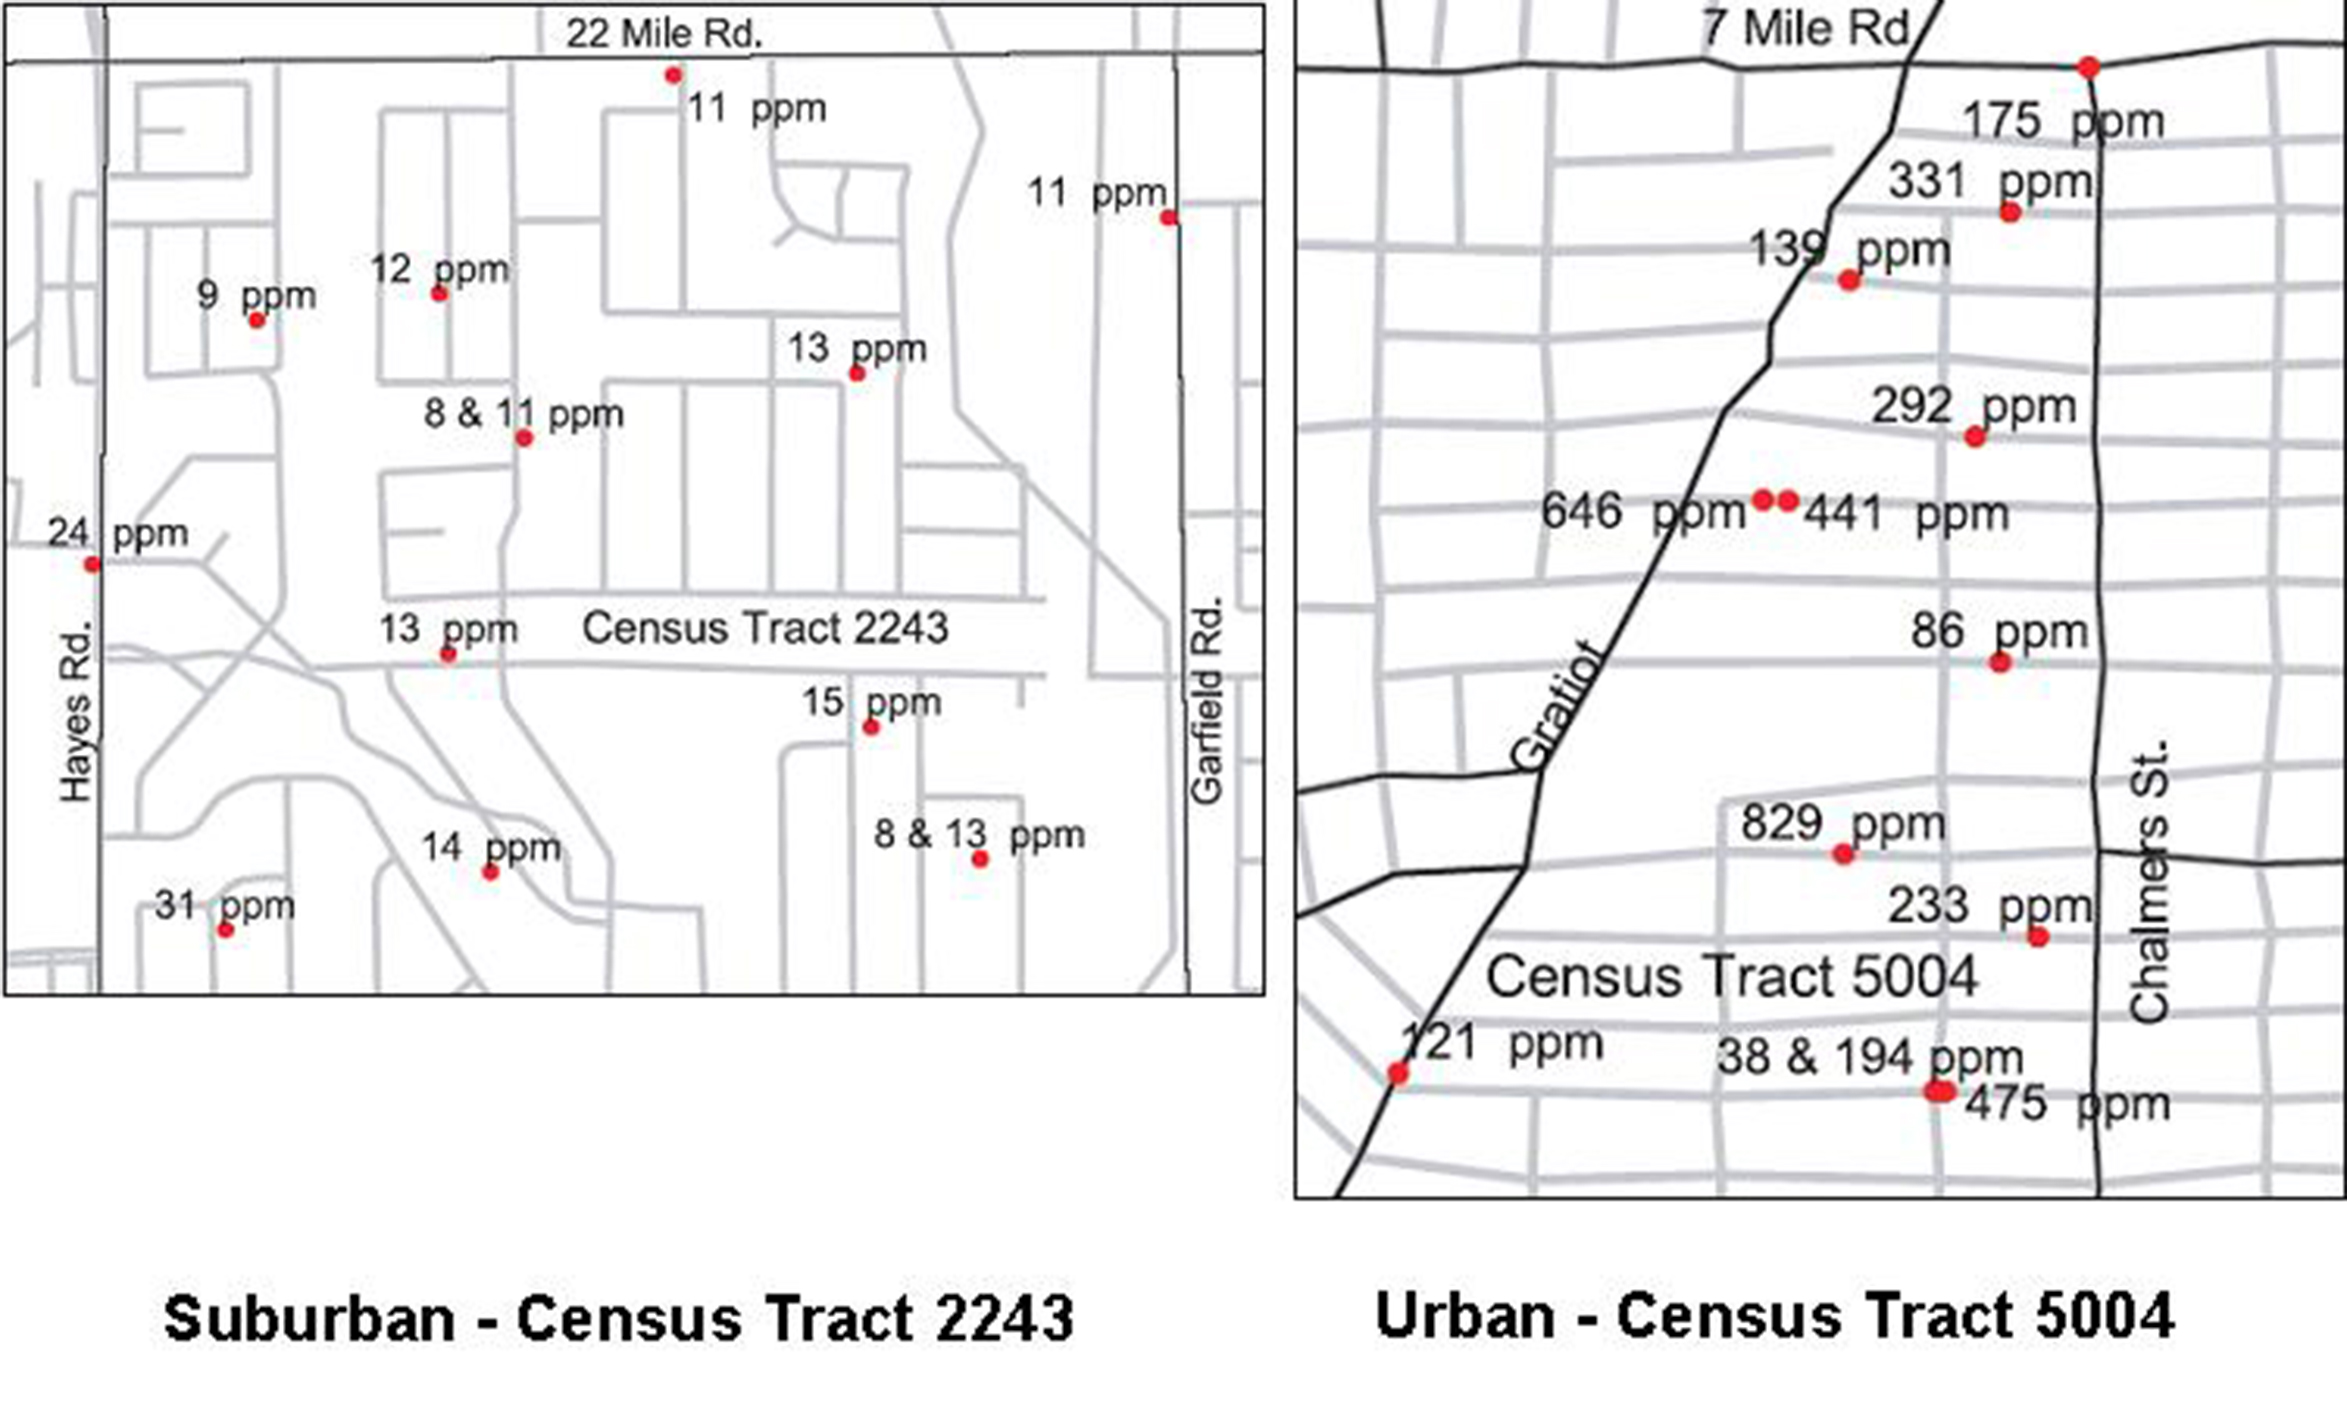
The Detroit Free Press investigation found that soil lead contamination in northeast Detroit at Gratiot and 7 Mile was 40 or 50 times the level in Macomb County, and well above the EPA limit of 400 parts per million. Currently, a study is being conducted to determine whether residential demolition increases lead contamination in surrounding soil. The City of Baltimore has instituted lead-safe demolition standards to address the issue there.
Often a home is in need of more than one type of repair – lead abatement, roof replacement, weatherization, fire safety, mold abatement, and so on. However, because different agencies administer the various programs, low-income Detroit homeowners may not be able to receive all of the repairs they need. The Detroit-Wayne County Green and Healthy Homes Initiative is advocating for geographical concentration of comprehensive home assessment and rehabilitation through multi-sector and interagency coordination. Led by ClearCorps/Detroit, the Detroit Enforcement Work Group is identifying strategies to increase landlord compliance with the 2010 Detroit Lead Ordinance, which updated the property maintenance code to require rental property owners to have their properties assessed and addressed for lead paint hazards.
Percentage of Homes Likely to Contain Lead-based Painted determined by Age of Housing.
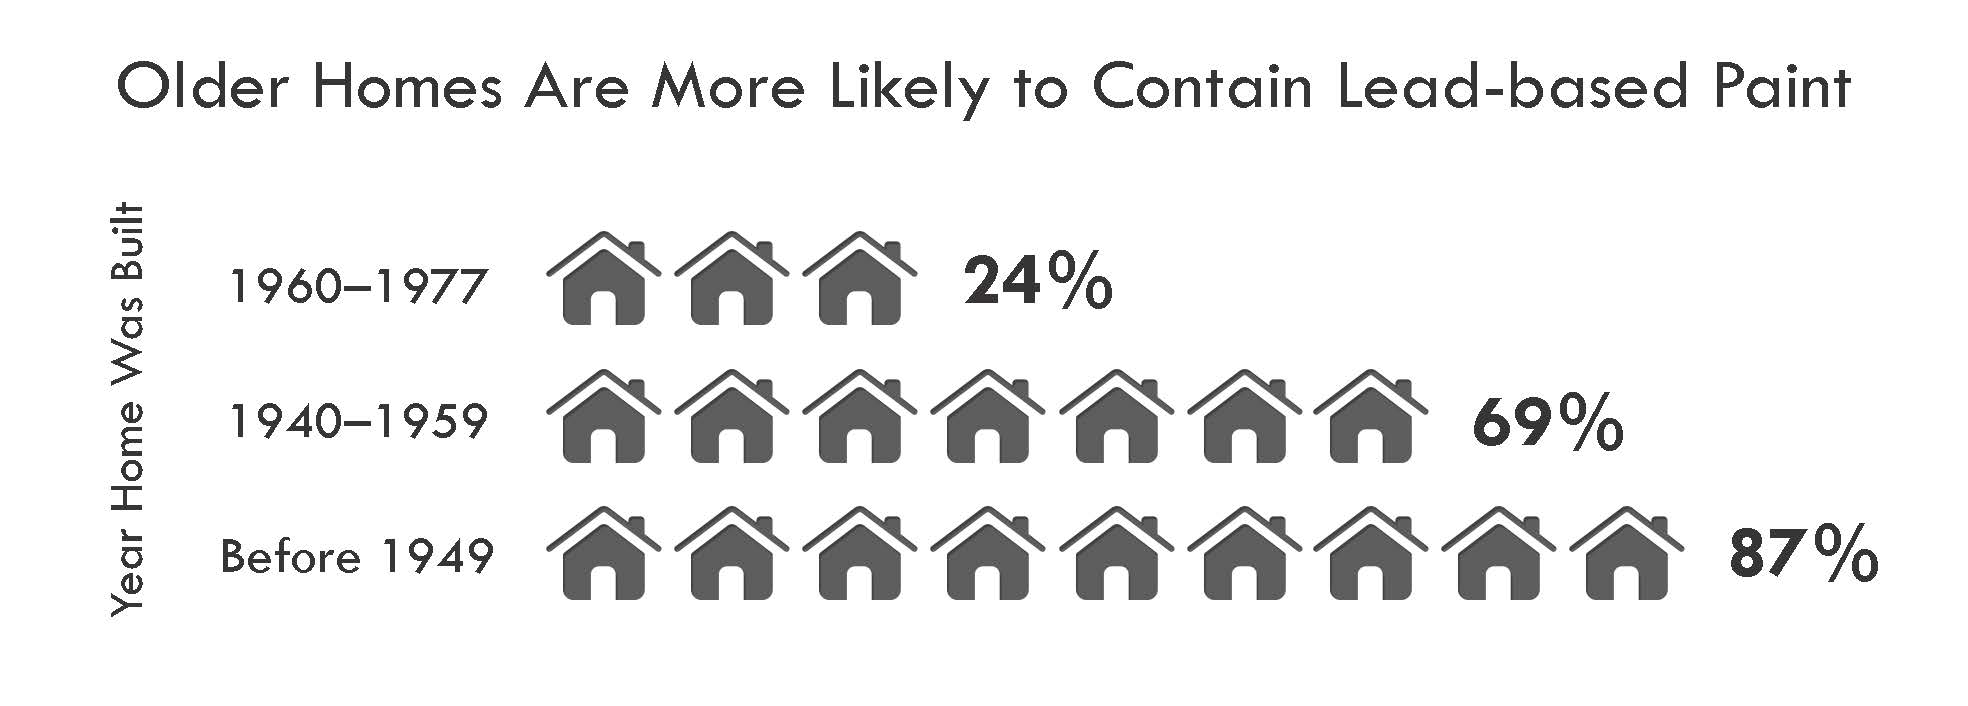
Over 90% of Detroit’s low-income housing was built before lead paint was banned.
(American Community Survey 2011)
Lead Poisoning & School Rankings
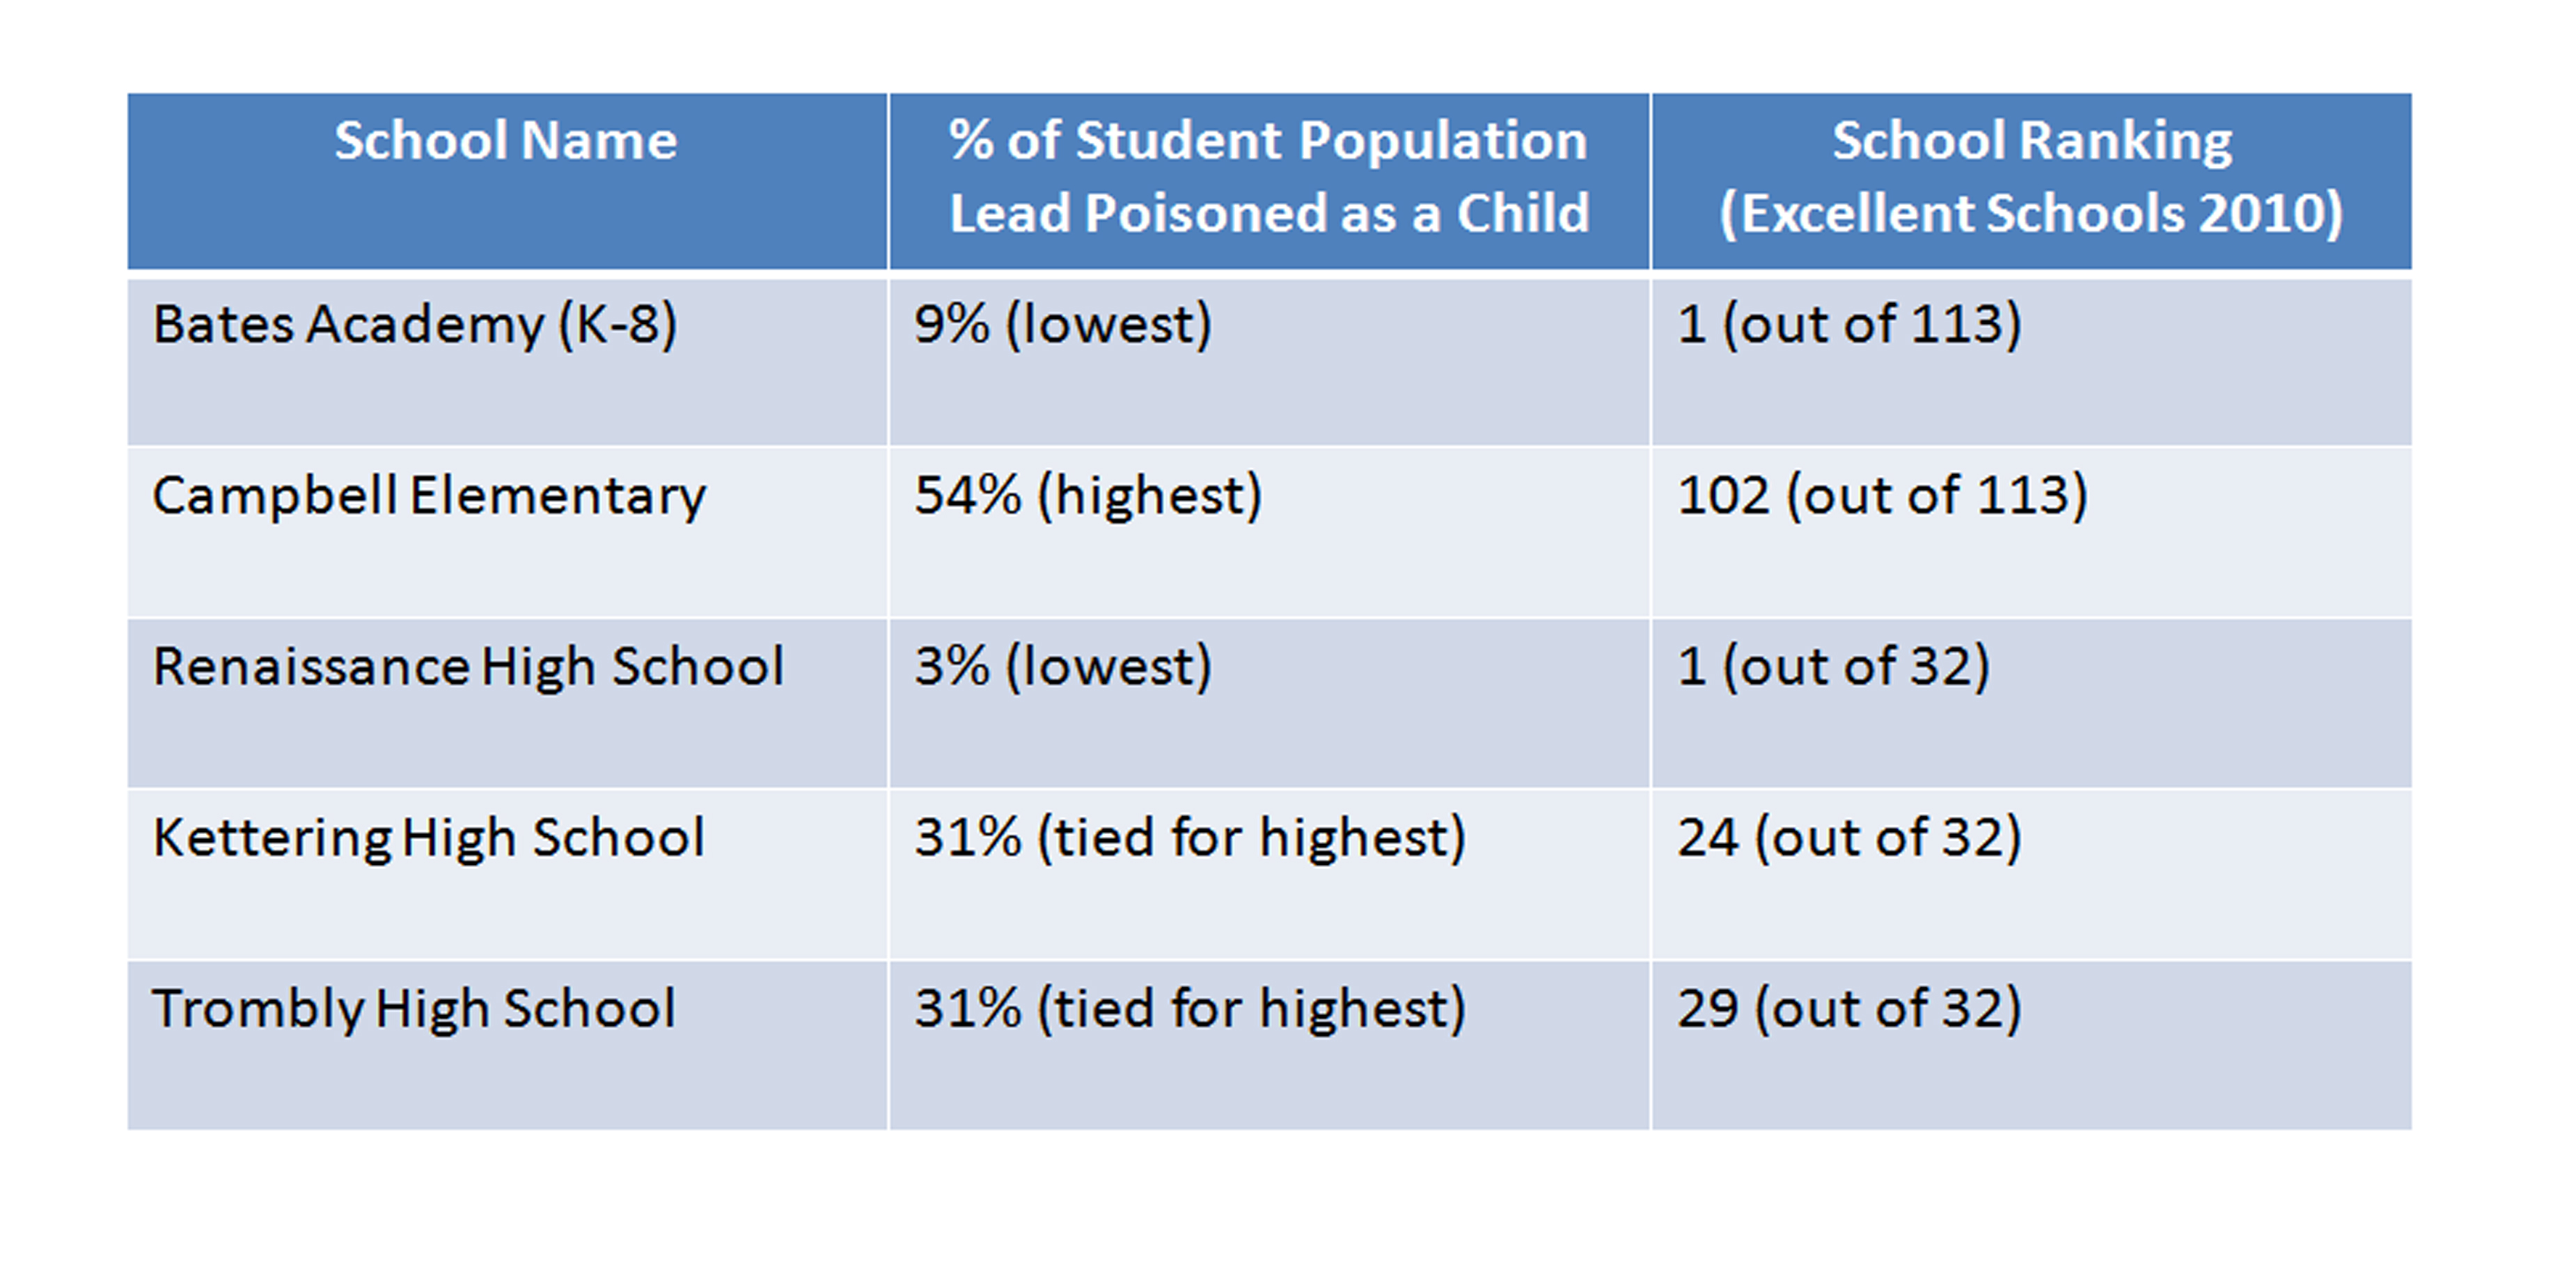
Because child lead poisoning has been linked in numerous studies to lower IQs, increased aggression, ADHD, juvenile delinquency, and adult criminal behavior, lead poisoning prevention should be one of Detroit’s top priorities. Poor nutrition (calcium and iron deficiency) makes children even more susceptible to the impacts of lead poisoning, making elevated blood lead levels an even greater challenge for low-income Detroit children than others who may be exposed to lead hazards.
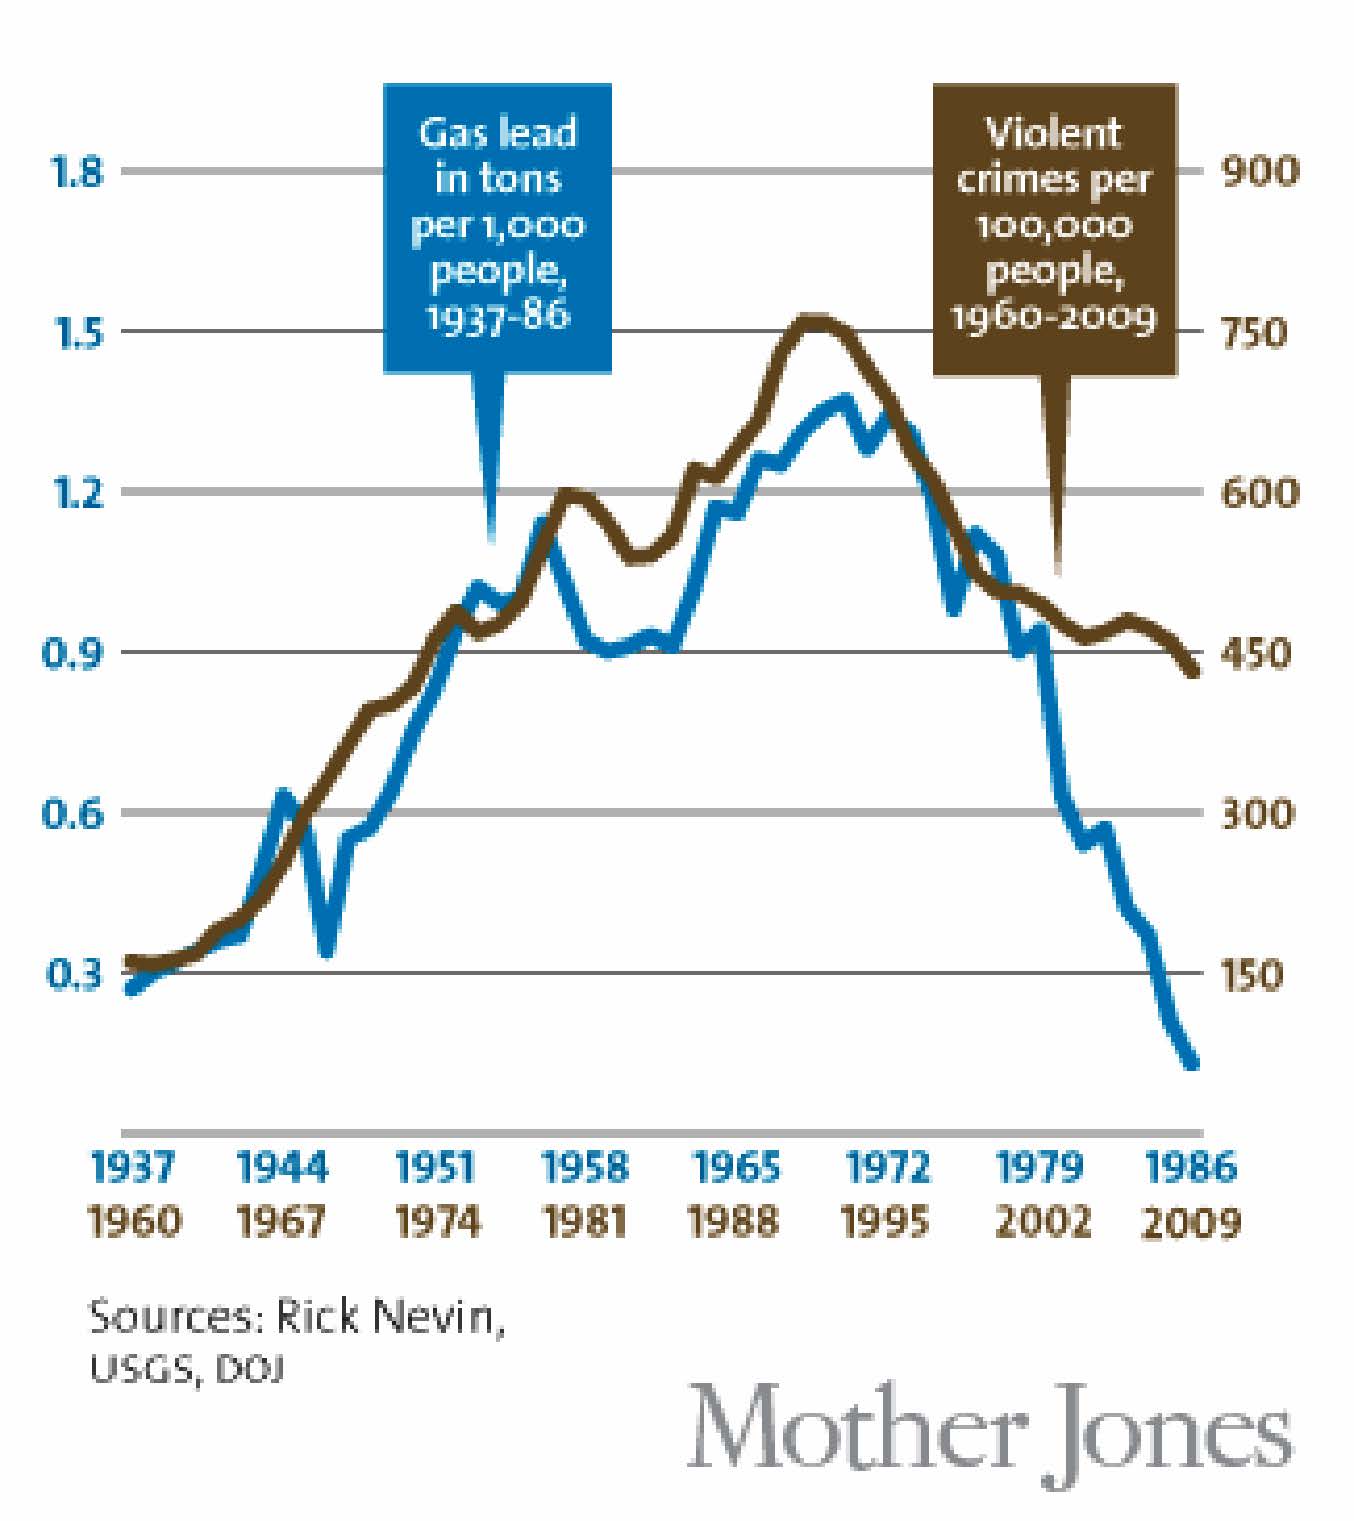
The US phaseout of leaded gasoline, in US cities as well as in other countries around the world, is correlated with falling rates of crime.
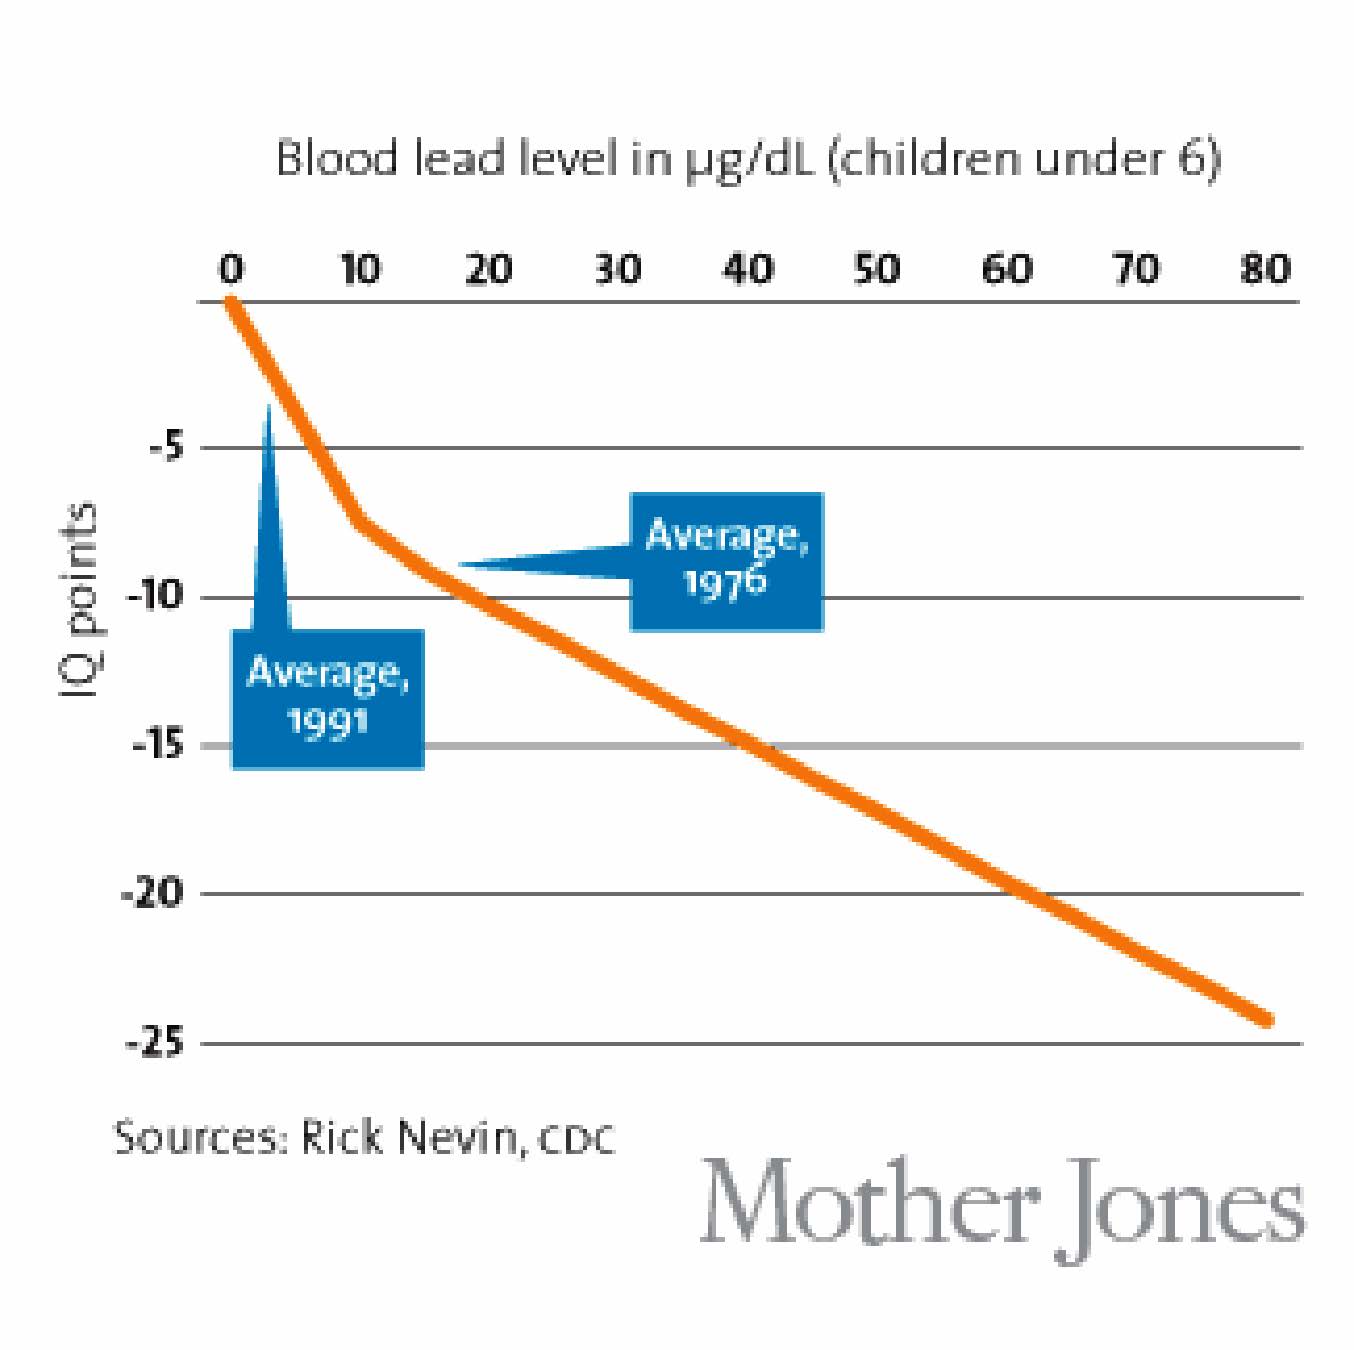
Elevated blood lead levels are correlated with drops in IQ.
Federal lead abatement programs administered through state and city government must continue to aggressively eliminate lead paint hazards and coordinate abatement with other home rehabilitation and weatherization programs, landlords must comply with the Detroit lead ordinance to address lead hazards in homes they rent to families, construction and demolition processes must be monitored for lead-safe practices, and healthy food access must be supported to help children fight the impacts of lead poisoning through proper nutrition.
Since 1998, lead poisoning rates decreased by 89% because of coordinated efforts and smart investments in rigorous testing, home lead abatement, code enforcement against negligent landlords, and treatment for lead poisoned children. However, recent state and federal cuts will reverse our progress.
“Success must be sustained, not stopped in its tracks.” – Luke Thompson, WSU and GHHI
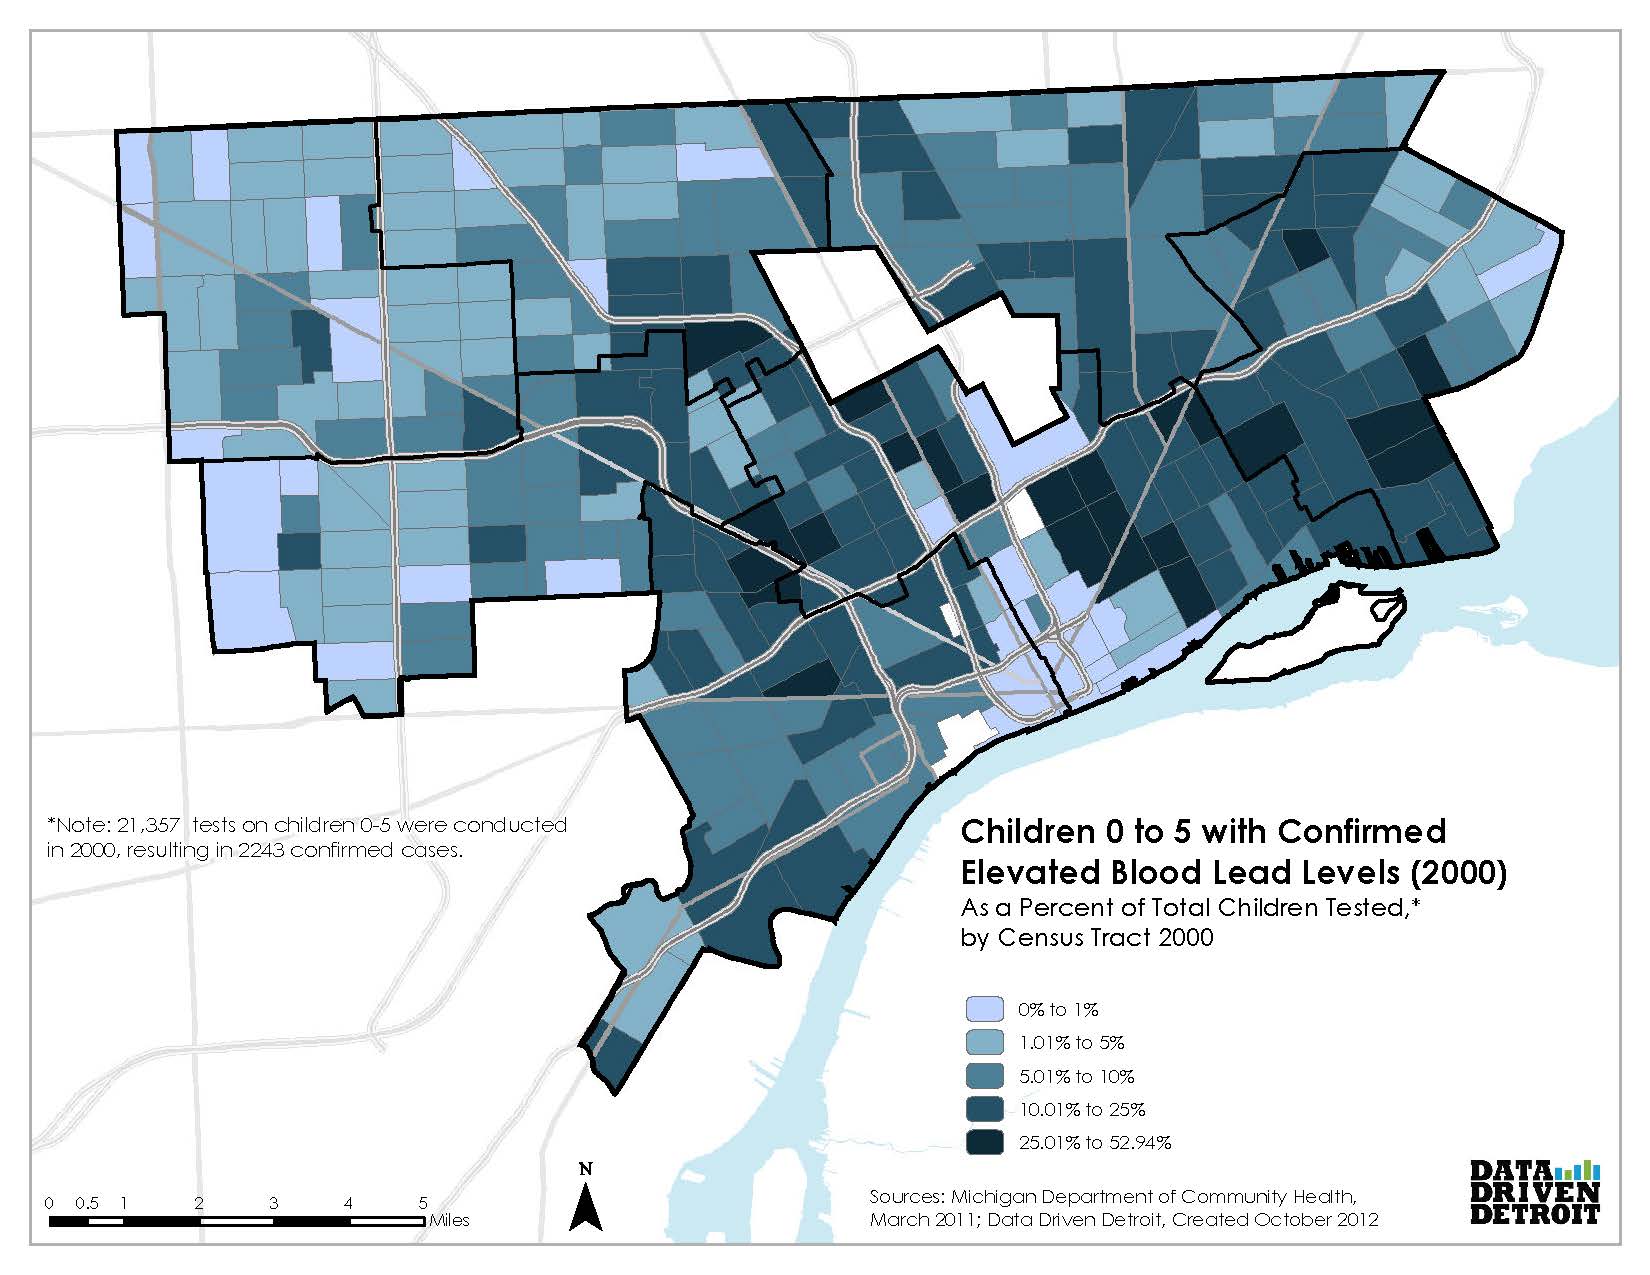
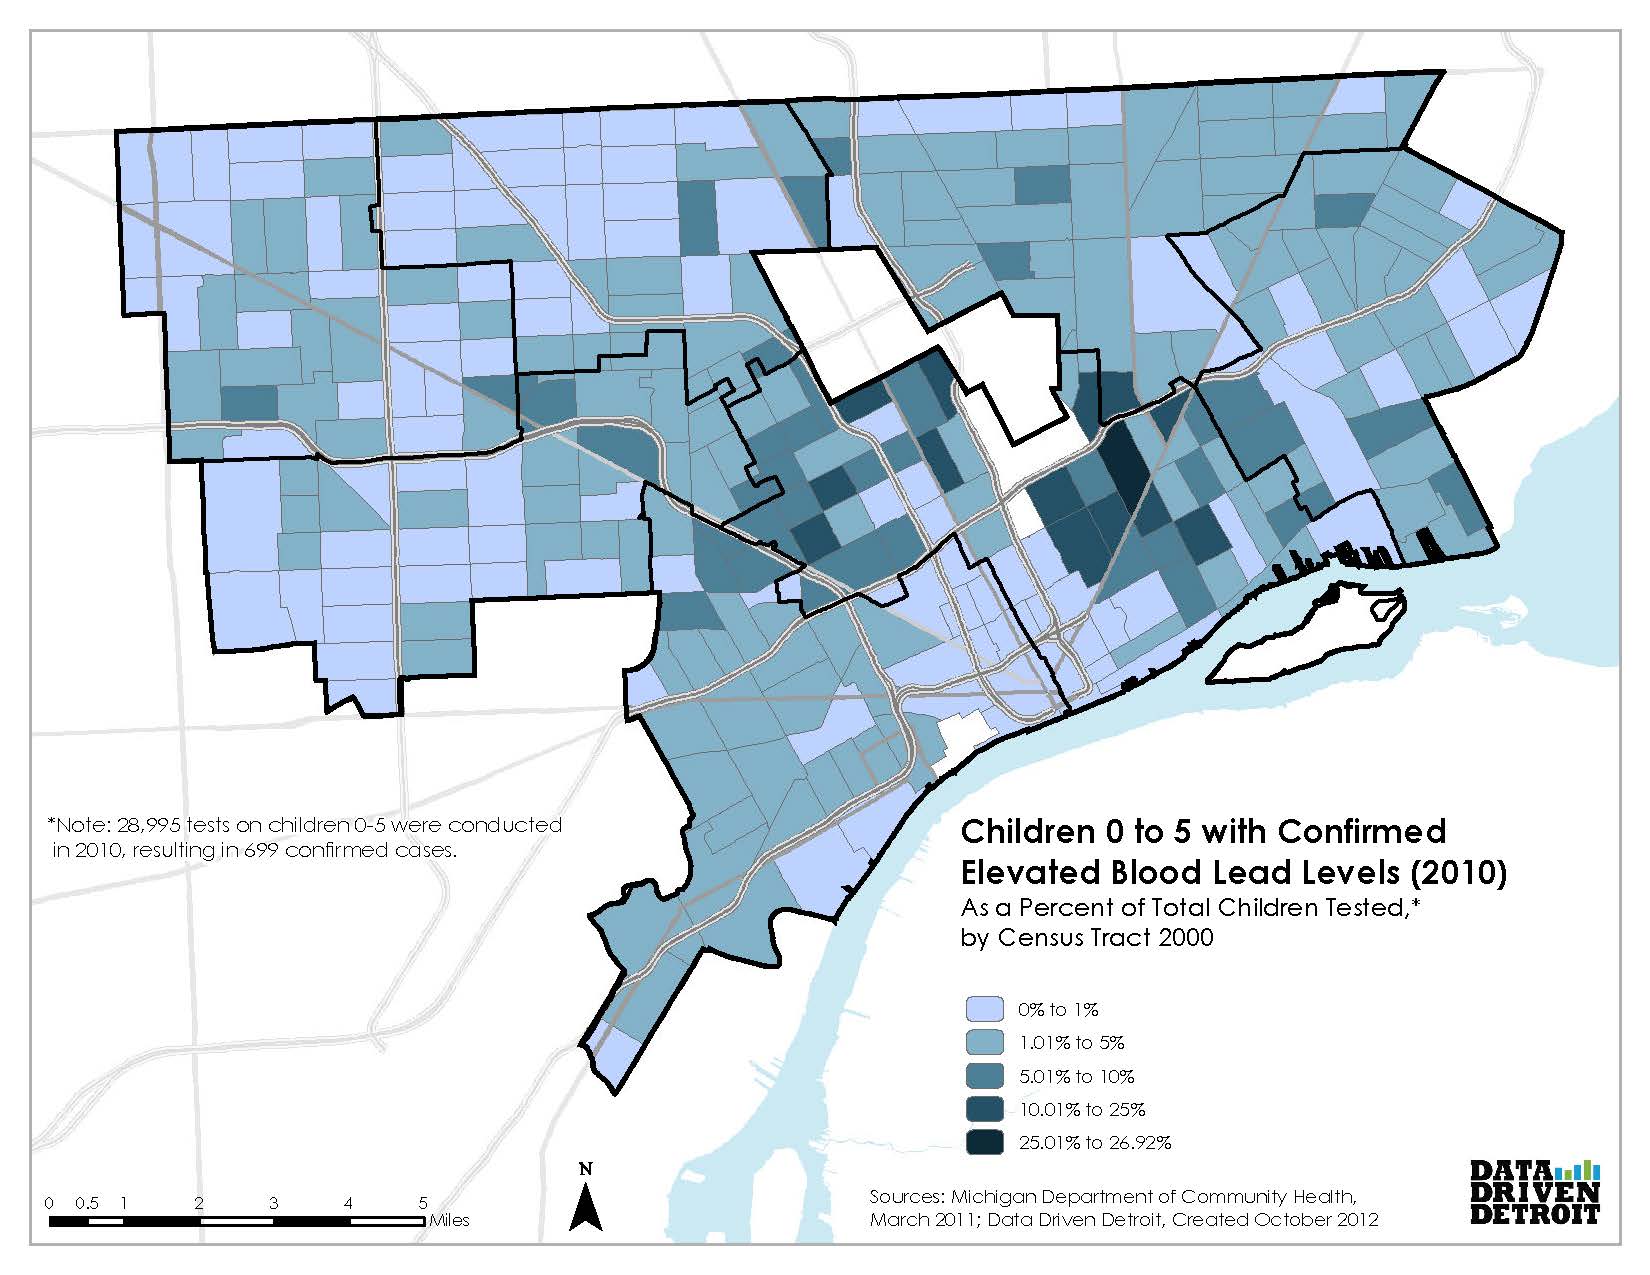
Detroit’s child lead poisoning rate has declined between 2000 and 2010. However, Detroit’s rate is still significantly higher than the state and national averages, and there are still areas of the city with high rates, particularly in District 5, and slightly less so in Districts 6, 3, and 4.